
- Customers expect ownership quickly: 90% called an immediate response important, and 60% defined immediate as ten minutes or less in HubSpot's cross-industry reporting.
- Contact and booking are different: Invoca reported that 61% of callers reached a person in its broad dataset, while its home-services phone-lead conversion benchmark was 46%.
- After-hours booking deserves its own report: ServiceTitan's analysis showed large-shop booking falling from a 61% peak to 21% after hours; small shops fell from 26% to 9%.
- Text-back can reopen—not complete—the funnel: a 2026 home-service study reported a 32.7% reply rate, with 74% of those replies arriving within five minutes.
- Your benchmark is the outcome chain: received time, acknowledgment, human contact, qualification, appointment, completion, collected revenue, and reason lost.
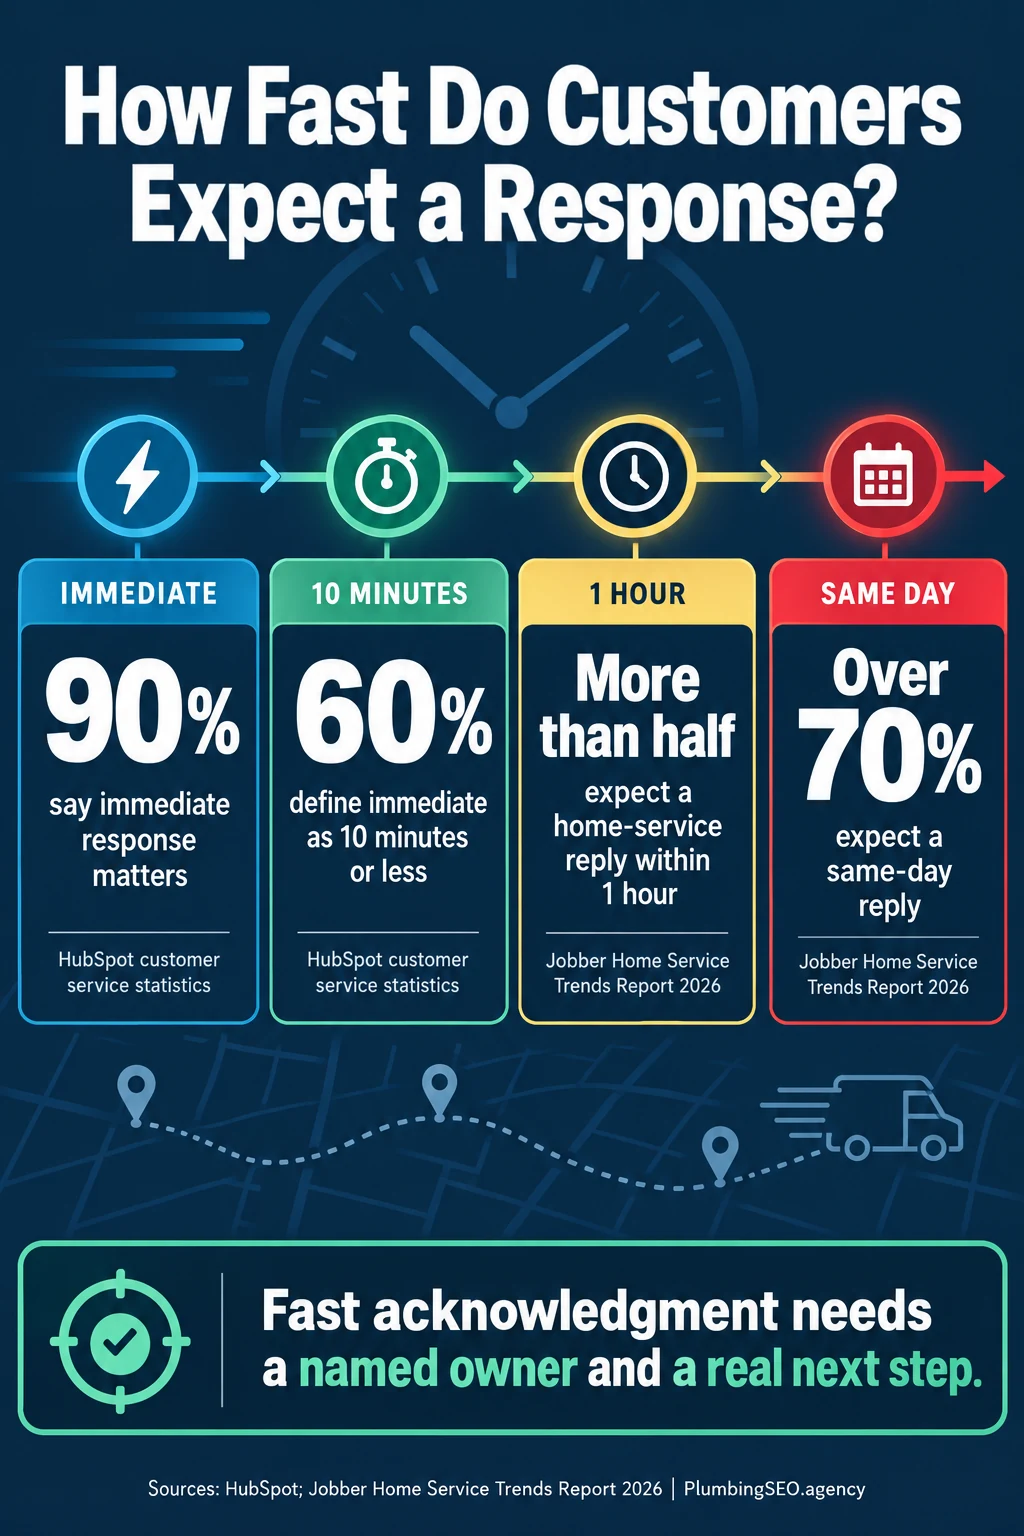
A plumbing lead can cool while a technician is under a sink, a dispatcher is transferring a call, or a web form is waiting in an inbox. Fast response matters, but a stopwatch alone does not explain performance. The useful question is whether a qualified homeowner reached someone who could take responsibility and offer a real next step.
This report organizes 70 numbered lead-response statistics covering initial contact, qualification, booking, after-hours performance, missed-call recovery, digital intake, and lead economics. It complements our plumbing missed-call statistics without replacing that call-answer analysis. Every table labels whether the data is plumbing-specific, home services, multiple trades, or cross-industry.
- Keep the source, year, population, channel, denominator, and outcome attached to every number.
- Separate automated acknowledgment from successful human contact.
- Report median and 90th-percentile response time; an average can hide abandoned leads.
- Segment office hours, lunch, overflow, nights, weekends, holidays, service line, and source.
- Do not multiply unrelated percentages into a fictional plumbing funnel.
Define plumbing lead response time before benchmarking it
“Response time” is not one event. An automated email can arrive in seconds while the customer still waits an hour for a person who can answer a question. A phone ring can be logged instantly even though nobody answers. A chat bot can collect a ZIP code without creating an appointment. Use separate timestamps for each handoff.
First acknowledgment
Elapsed time from the inquiry timestamp to a delivered confirmation. This proves the system received the request, not that a person engaged.
First human response
Elapsed time to a real conversation or two-way exchange with someone who can own the next step.
Time to successful contact
Elapsed time until the company reaches the customer—not merely until it attempts a callback.
Time to booking
Elapsed time until a valid appointment is accepted and recorded. It should remain separate from time to available service.
A lead-tracking system for plumbers should preserve all of these events. Keep spam, duplicates, wrong-area contacts, unsupported work, and existing-customer service messages visible, but exclude them from the qualified-opportunity booking denominator.
1. Response expectations, live contact, and qualification statistics
Invoca's 2025 reporting analyzed more than 60 million calls and included a home-services segment. HubSpot's figures reflect broad customer expectations, while Jobber reports home-service expectations. These sources do not describe one shared funnel, so each row keeps its original scope.
| # | Response or contact benchmark | Value | Source | Scope |
|---|---|---|---|---|
| 1 | Calls included in the call-performance analysis | 60M+ | Invoca via Supply House Times, 2025 | Dataset size |
| 2 | Callers who spoke with a person | 61% | Invoca, 2025 | Cross-industry |
| 3 | Range in call answer rates | 54%–69% | Invoca, 2025 | Range across measured industries |
| 4 | Digital-marketing calls classified as qualified leads | 35% | Invoca, 2025 | Cross-industry |
| 5 | High-end lead rate reported for some industries | 54% | Invoca, 2025 | Industry high end |
| 6 | Phone leads converting during the call | 37% | Invoca, 2025 | Cross-industry |
| 7 | Home-services phone leads converting during the call | 46% | Invoca, 2025 | Multiple home-service trades |
| 8 | Calls rated excellent by contact-center managers | 28% | Invoca, 2025 | Manager rating |
| 9 | Agents who asked the lead to buy or book | 35% | Invoca, 2025 | Observed call behavior |
| 10 | Automotive phone-lead conversion | 42% | Invoca, 2025 | Industry comparison |
| 11 | Business-services phone-lead conversion | 22% | Invoca, 2025 | Industry comparison |
| 12 | Customers rating immediate response important or very important | 90% | HubSpot | Cross-industry expectation |
| 13 | Customers defining immediate response as ten minutes or less | 60% | HubSpot | Cross-industry definition |
| 14 | Home-service customers expecting a same-day response | Over 70% | Jobber, 2026 | Home-service research |
| 15 | Home-service customers expecting a response within an hour | More than half | Jobber, 2026 | Home-service research |
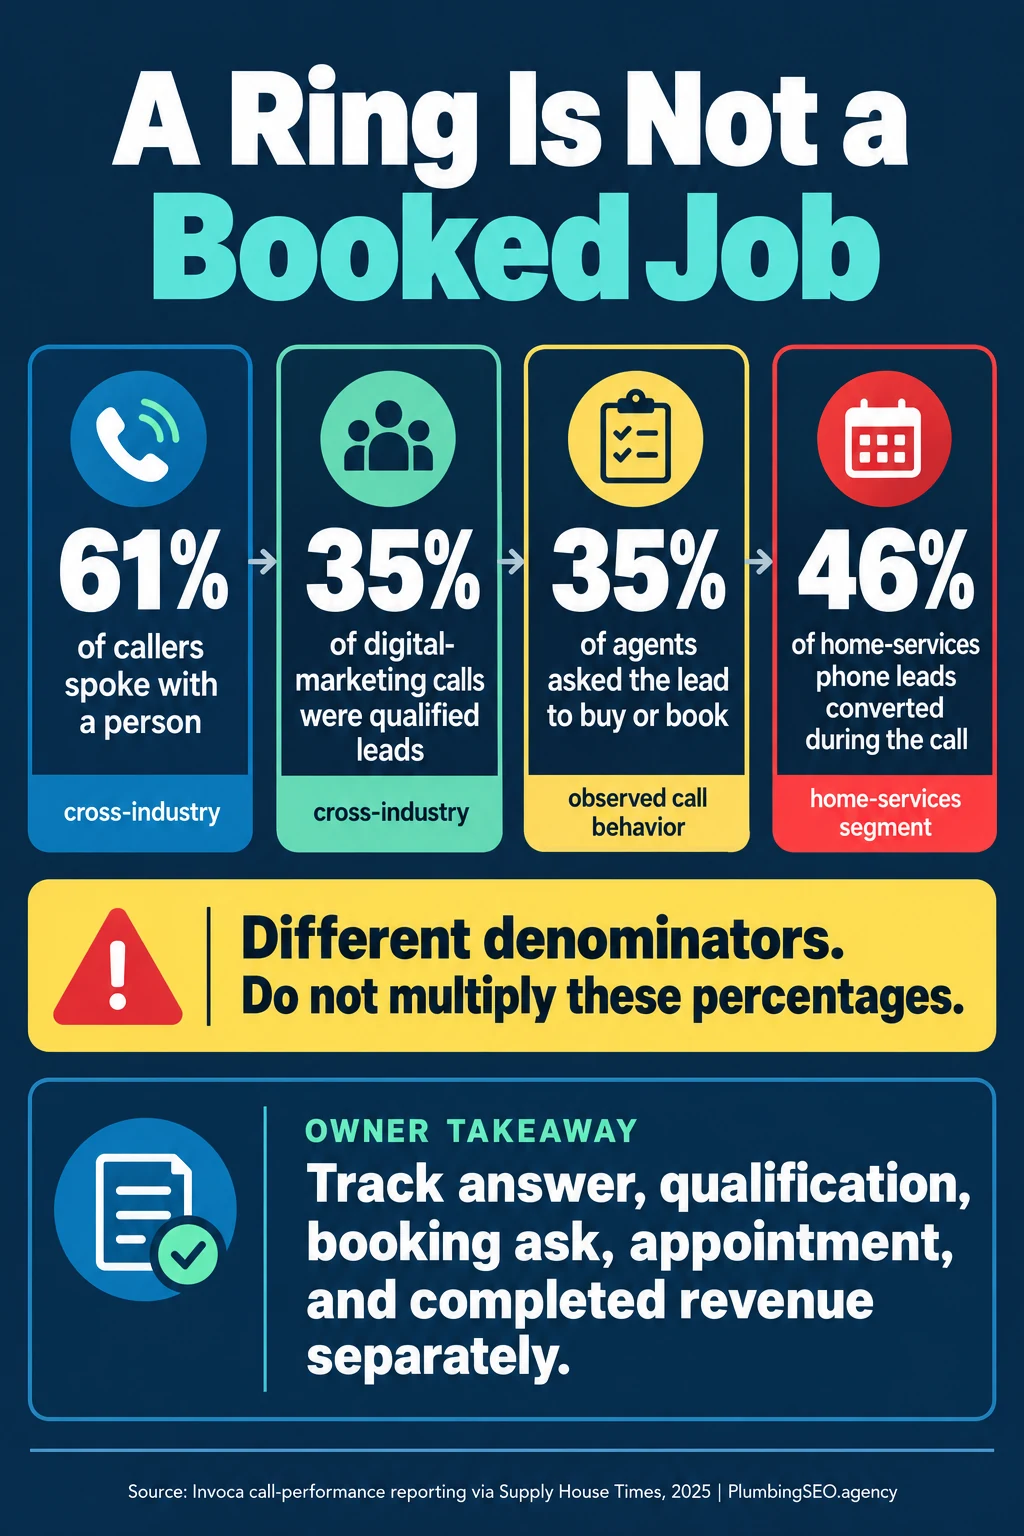
The practical lesson is not “beat a universal five-minute rule.” It is to route each inquiry to someone who can identify the company, confirm the service area and issue, triage urgent property damage, offer an appointment, and document the result. Our plumbing customer-service statistics cover the wider service experience after contact.
2. Call-booking and after-hours response statistics
ServiceTitan's 2022 analysis covered more than 3,000 trade businesses. It is older and platform-specific, but it offers uncommon detail by company size, trade, and daypart. A booking rate is not an answer rate, and the 90% row below is an expert target described by the source—not an observed average.
| # | Booking benchmark | Value | Source | Scope |
|---|---|---|---|---|
| 16 | Typical call-booking rate | 42% | ServiceTitan, 2022 | Trade businesses |
| 17 | Businesses included in the booking analysis | 3,000+ | ServiceTitan, 2022 | Platform dataset |
| 18 | Booking rate for businesses with 25+ technicians | 59% | ServiceTitan, 2022 | Large-shop cohort |
| 19 | Booking rate for businesses with fewer than five technicians | 24% | ServiceTitan, 2022 | Small-shop cohort |
| 20 | Plumbing June booking rate | 43% | ServiceTitan, 2022 | Plumbing; named-month comparison |
| 21 | Electrical June booking rate | 41% | ServiceTitan, 2022 | Trade comparison |
| 22 | HVAC June booking rate | 38% | ServiceTitan, 2022 | Trade comparison |
| 23 | Garage-door and water-treatment booking rate | 31% | ServiceTitan, 2022 | Trade comparison |
| 24 | Large-shop peak booking rate | 61% | ServiceTitan, 2022 | Time-of-day high |
| 25 | Large-shop after-hours booking rate | 21% | ServiceTitan, 2022 | Time-of-day low |
| 26 | Small-shop peak booking rate | 26% | ServiceTitan, 2022 | Time-of-day high |
| 27 | Small-shop after-hours booking rate | 9% | ServiceTitan, 2022 | Time-of-day low |
| 28 | Year-over-year monthly booking-rate lift | 2%–5% | ServiceTitan, 2022 | 2022 versus 2021 |
| 29 | Illustrative annual revenue tied to a five-point booking lift | About $100K | ServiceTitan, 2022 | 5–14-technician businesses; estimate |
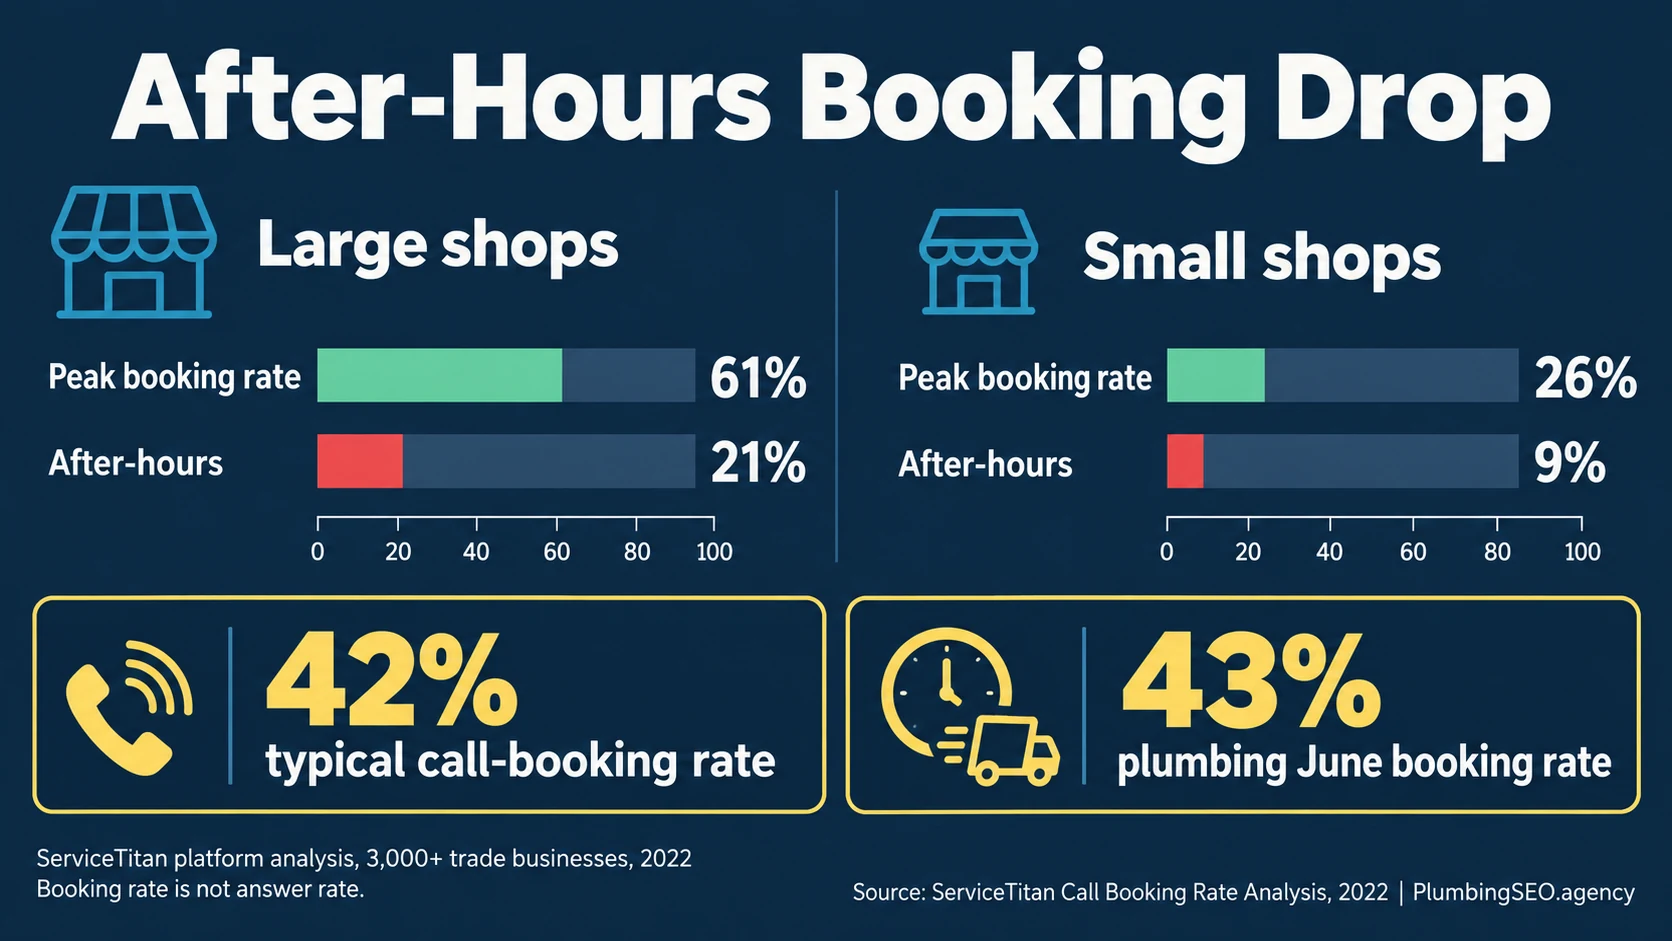
What to do: report office hours, lunch, overflow, evening, overnight, weekend, and holiday inquiries separately. Measure whether an answering service merely takes a message or actually completes a correct booking. The operational sequence belongs in a documented missed-call recovery workflow for plumbers.
3. Missed-call recovery and follow-up timing statistics
The 99 Calls study measured automated text-back replies across home-service businesses; it did not report a universal plumbing booking rate. Hatch analyzed HVAC estimate campaigns, and Simpro supplies trade-service reminder guidance. This section therefore separates urgent contact recovery from slower estimate and maintenance follow-up.
| # | Recovery or follow-up benchmark | Value | Source | Scope |
|---|---|---|---|---|
| 30 | Missed-call text messages analyzed | 14,354 | 99 Calls, 2026 | Study sample |
| 31 | Home-service businesses represented | 192 | 99 Calls, 2026 | Multiple home-service trades |
| 32 | Reply rate to missed-call text-back messages | 32.7% | 99 Calls, 2026 | Replies, not bookings |
| 33 | Text-back replies arriving within five minutes | 74% | 99 Calls, 2026 | Among replies |
| 34 | Texts in a frequently effective estimate cadence | 5 | Hatch estimate analysis | HVAC campaign pattern |
| 35 | Emails in that estimate cadence | 2 | Hatch estimate analysis | HVAC campaign pattern |
| 36 | Length of that estimate follow-up cadence | 7 days | Hatch estimate analysis | HVAC campaign pattern |
| 37 | Average response rate cited across analyzed campaigns | 60% | Hatch estimate analysis | Vendor analysis; responses |
| 38 | Early service-reminder checkpoint | 90 days | Simpro reminder guide | Trade-service guidance |
| 39 | Second service-reminder checkpoint | 60 days | Simpro reminder guide | Trade-service guidance |
| 40 | Third service-reminder checkpoint | 30 days | Simpro reminder guide | Trade-service guidance |
| 41 | Final pre-due maintenance window | 7–14 days | Simpro reminder guide | Trade-service guidance |
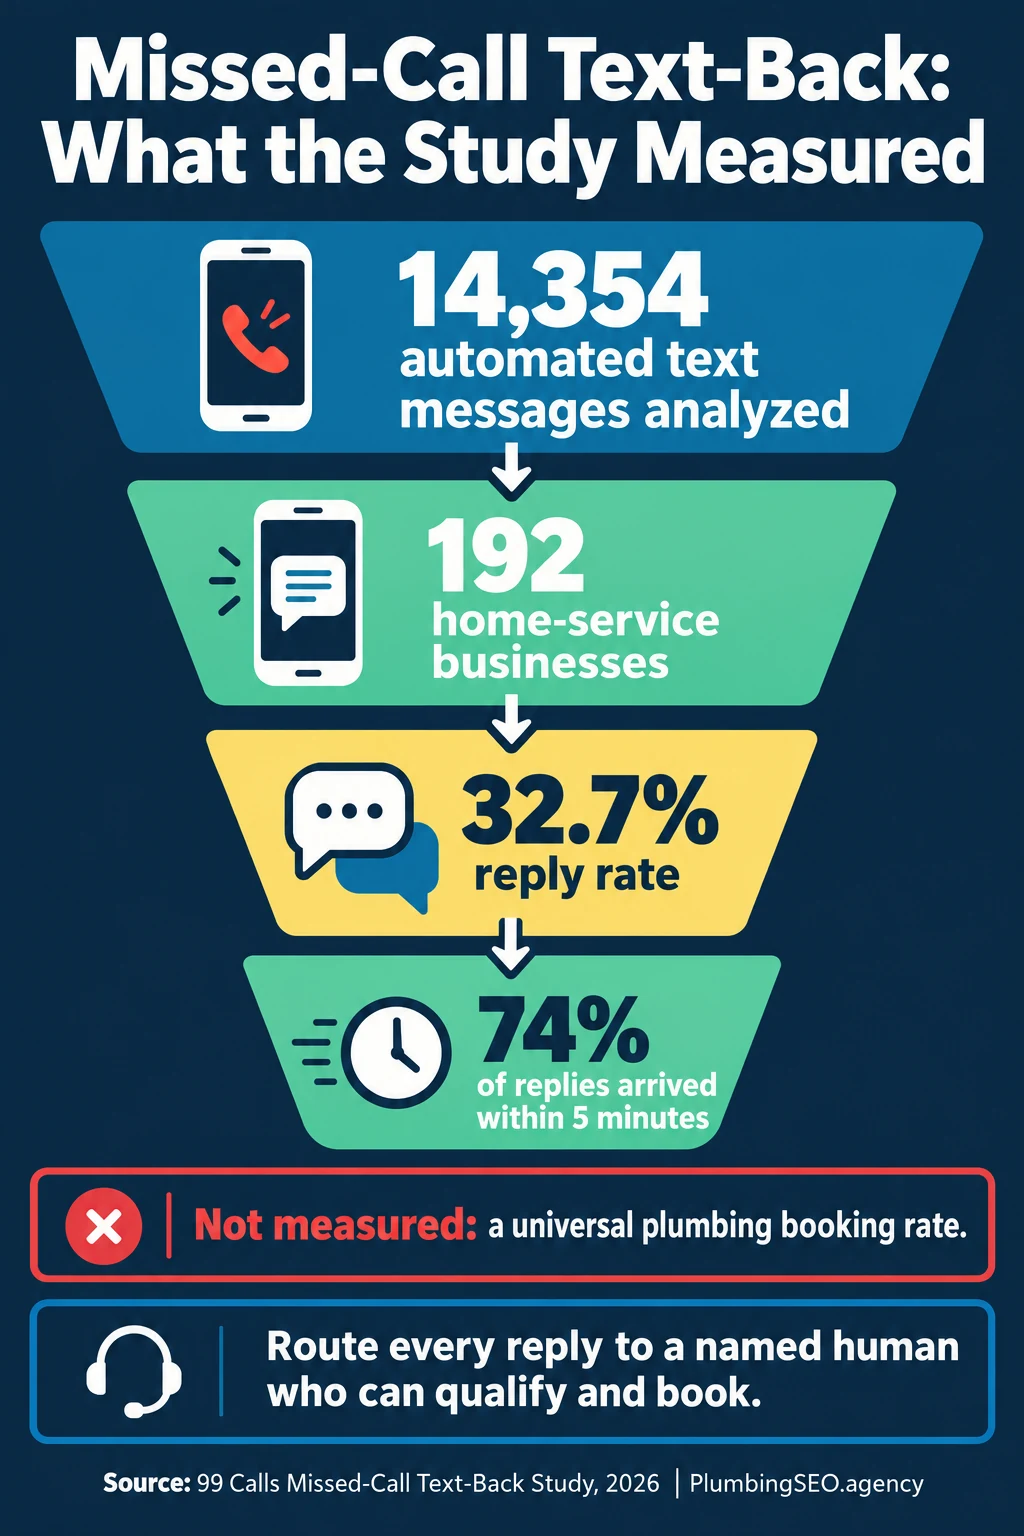
Do not use an estimate cadence for an active leak, and do not use emergency urgency for a maintenance reminder. Match the timing, channel, and escalation path to the customer event. The broader plumbing email and SMS statistics report covers messaging metrics and compliance limits in more detail.
4. Website, scheduler, and digital-intake response statistics
A fast phone response does not rescue an unmonitored web form. Housecall Pro surveyed 1,040 U.S. homeowner decision-makers. ServiceTitan reports contractor-booking expectations, and Pew measures mobile access. These statistics show why digital intake must enter the same owned response queue as calls.
| # | Digital-intake benchmark | Value | Source | Response implication |
|---|---|---|---|---|
| 42 | Homeowner decision-makers surveyed | 1,040 | Housecall Pro, 2025 | U.S. online survey |
| 43 | Homeowners factoring online booking into provider choice | 80% | Housecall Pro, 2025 | Scheduler affects selection |
| 44 | Homeowners expecting a professional, user-friendly website | 96% | Housecall Pro, 2025 | Intake starts before submission |
| 45 | Homeowners comfortable with AI handling initial inquiries | 53% | Housecall Pro, 2025 | Initial inquiry only |
| 46 | Homeowners appreciating a technician name and photo before arrival | Nearly 60% | Housecall Pro, 2025 | Pre-arrival communication |
| 47 | Homeowners expecting photo or video proof after work | 68% | Housecall Pro, 2025 | Close the service loop |
| 48 | Homeowners saying instant estimates influence hiring | 93% | Housecall Pro, 2025 | Stated hiring influence |
| 49 | Homeowners frustrated by hidden costs | 77% | Housecall Pro, 2025 | Response needs pricing clarity |
| 50 | Homeowners who value useful tips from technicians | 70% | Housecall Pro, 2025 | Education supports trust |
| 51 | Homeowners saying they would hire the same company again | 68% | Housecall Pro, 2025 | Repeat-hire intention |
| 52 | Consumers reported as expecting online booking | 70% | ServiceTitan, 2024 | Contractor context |
| 53 | New-contractor shoppers more likely to choose online booking | 94% | ServiceTitan, 2024 | Stated likelihood |
| 54 | U.S. adults owning a smartphone | 91% | Pew Research Center, 2025 | U.S. adult access |
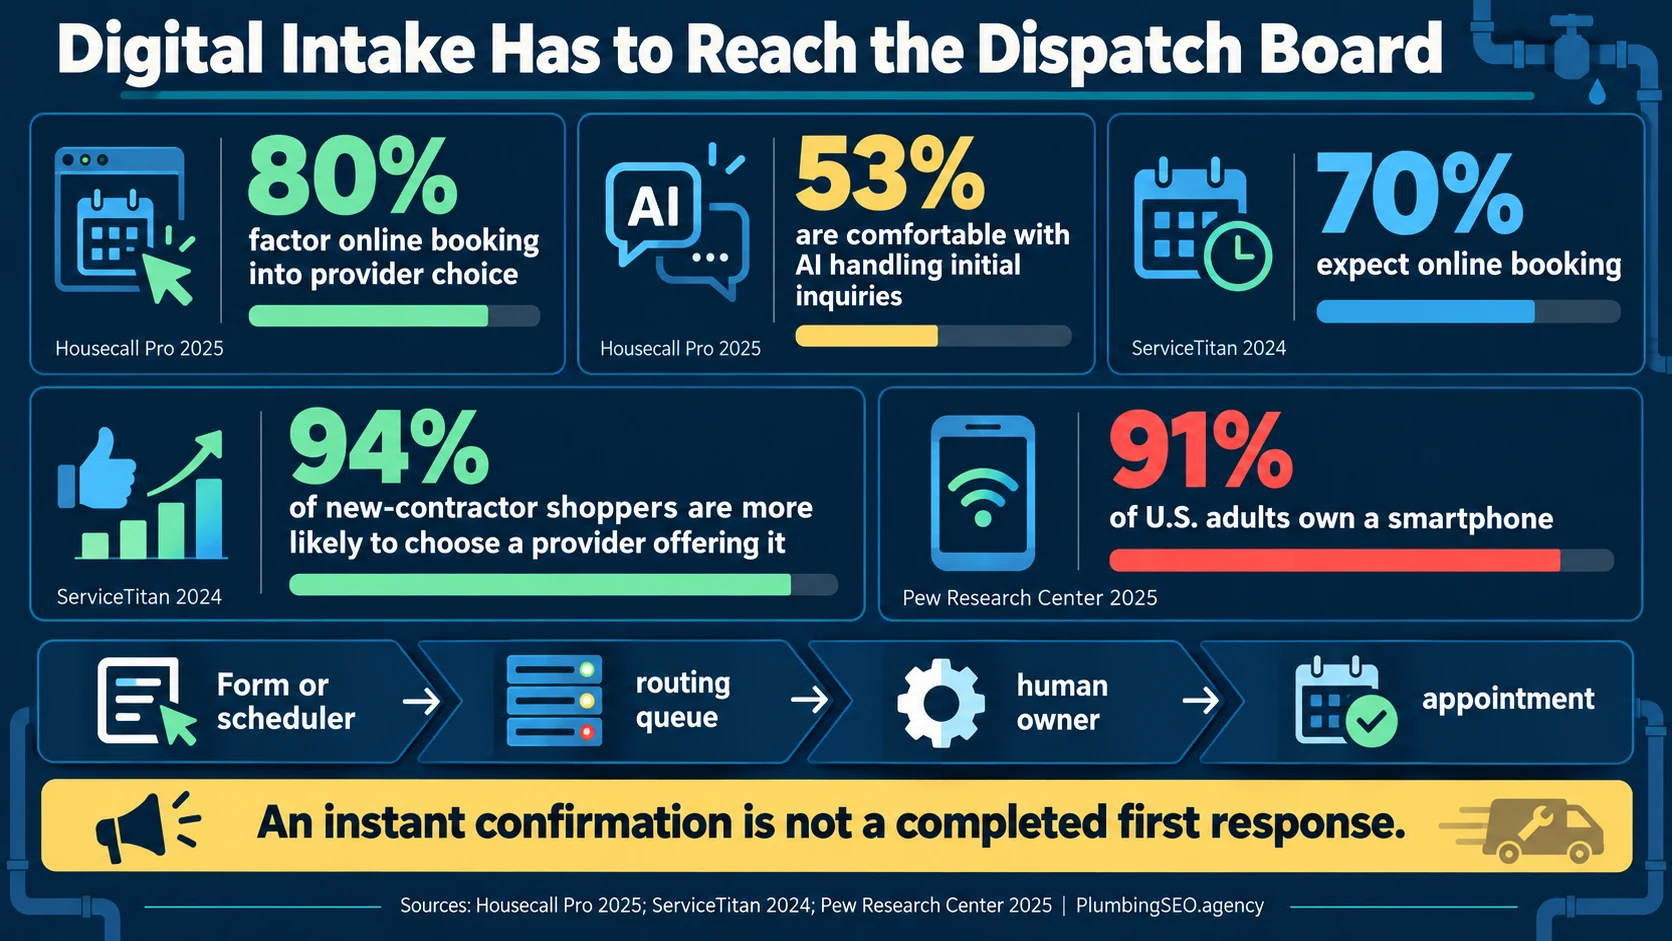
What this means for plumbers: route forms, schedulers, chat, Local Services Ads messages, social messages, and email into one monitored queue. Preserve the original submission time, source, page, service, ZIP code, acknowledgment, human owner, and final disposition. Our comparison of plumbing website forms versus click-to-call explains how to match the intake path to customer intent.
5. Lead-cost and booking-economics statistics
Response failure is more expensive when demand was paid for. LocaliQ analyzed more than 3,200 home-services search campaigns running from April 2024 through March 2025. SearchLight publishes separate 2026 LSA and plumbing Google Ads datasets. Definitions differ, so the figures should not be blended into one average.
| # | Lead-economics benchmark | Value | Source | Scope |
|---|---|---|---|---|
| 55 | Home-services campaigns in the search benchmark | 3,200+ | LocaliQ, 2025 | April 2024–March 2025 |
| 56 | Plumbing paid-search click-through rate | 4.97% | LocaliQ, 2025 | Plumbing search campaigns |
| 57 | Plumbing paid-search cost per click | $10.49 | LocaliQ, 2025 | Plumbing search campaigns |
| 58 | Plumbing paid-search conversion rate | 7.63% | LocaliQ, 2025 | Configured campaign conversions |
| 59 | Plumbing paid-search cost per lead | $129.02 | LocaliQ, 2025 | Not cost per booking |
| 60 | Home-services Local Services Ads cost per lead | $53 | SearchLight, 2026 | Home services |
| 61 | Local Services Ads booking rate | 43.9% | SearchLight, 2026 | Dataset average |
| 62 | Local Services Ads cost per paying customer | $233 | SearchLight, 2026 | Dataset average |
| 63 | Plumbing non-branded search cost per lead | $183 | SearchLight, 2026 | Plumbing campaign dataset |
| 64 | Plumbing Performance Max cost per lead | $82 | SearchLight, 2026 | Plumbing campaign dataset |
Put response metrics beside plumber cost-per-lead benchmarks. A source can produce an acceptable inquiry cost and still lose money because routing, contact, capacity, or booking fails. Connect the record through a plumbing lead CRM rather than grading channels on rings and form fills alone.
6. Mobile page speed, landing-page scale, and experience statistics
The response clock begins before the form is submitted. A slow mobile page can prevent the contact attempt, while a confusing confirmation can make the homeowner submit twice or call another company. The final six figures provide cross-industry digital and customer-experience context rather than plumbing response-time averages.
| # | Experience benchmark | Value | Source | Scope |
|---|---|---|---|---|
| 65 | Mobile visitors leaving pages that took over three seconds to load | 53% | Think with Google, 2017 | Historical mobile research |
| 66 | Landing pages in the conversion benchmark | 41,000+ | Unbounce, 2024 | Cross-industry dataset |
| 67 | Unique visitors in the conversion benchmark | 464M | Unbounce, 2024 | Cross-industry dataset |
| 68 | Conversions in the conversion benchmark | 57M | Unbounce, 2024 | Cross-industry dataset |
| 69 | Consumers saying experience is an important buying factor | 73% | PwC | Cross-industry |
| 70 | Customers saying service is as important as product quality | 88% | Salesforce | Cross-industry |
What this means for plumbers: keep urgent service pages fast, make click-to-call visible, keep forms short, show what happens after submission, and send every channel into the same response process. The plumbing lead-generation statistics guide covers the upstream channel mix; this report begins where the inquiry reaches the company.
Build a plumbing speed-to-lead scorecard that reaches revenue
External statistics can reveal where to look. Your call logs, form timestamps, message records, CRM dispositions, dispatch board, invoices, and payments show what to fix. Report each metric by source, service, market, daypart, and new versus repeat customer.
1Arrival
Track unique contacts, received timestamp, channel, source, campaign, landing page, phone number or form, and whether the inquiry occurred inside staffed hours.
2Acknowledgment
Track delivery time, channel, automation used, failed sends, duplicate confirmations, consent status, and whether the customer was told a realistic next step.
3Human contact
Track live answer, first human reply, callback attempts, successful contact, named owner, median response, 90th percentile, and aged unowned inquiries.
4Qualification
Tag spam, duplicate, service area, service type, urgency, customer status, qualified opportunity, booking ask, objection, and loss reason.
5Booking
Track appointment offered, appointment accepted, time to booking, arrival window, cancellation, reschedule, no-show, dispatch, and completion.
6Economics
Connect inquiry cost, booked-job cost, completed-job cost, collected revenue, gross profit, refund, warranty callback, repeat work, and source-level return.
Recommended response-time buckets
Use fixed buckets so weekly reports are comparable: live answer, 0–5 minutes, 6–10 minutes, 11–30 minutes, 31–60 minutes, 1–4 hours, same day, next day, and never contacted. Show counts beside percentages. A tiny sample can make a rate look dramatic.
A practical weekly review
- Audit one live-answer booking, one slow response, one lost qualified opportunity, one recovered missed call, and one after-hours inquiry.
- Listen to the call or read the actual message instead of trusting the disposition alone.
- Find the first failed handoff: notification, routing, queue ownership, callback, service-area check, schedule access, booking ask, or follow-up.
- Assign one owner and one deadline for the fix.
- Check booked jobs, completed work, and collected revenue in the next meeting.
Methodology and source notes
This article was published October 21, 2026. It contains exactly 70 numbered statistics from 17 source records across 15 source families. We prioritized large call datasets, trade-platform analyses, home-service research, original consumer surveys, mobile research, and source pages that identify the metric and population. Every numbered row keeps its reported scope.
What we excluded: recycled claims that responding in a particular minute makes a company a fixed multiple more likely to qualify or close a lead when we could not verify the original study and definition; unsupported statements that most customers hire the first responder; vendor promises without a visible denominator; and any invented universal plumbing response, contact, or booking target.
- Invoca call-performance reporting via Supply House Times (2025) — more than 60 million calls, including a home-services segment.
- HubSpot Customer Service Statistics — cross-industry expectations for immediate response.
- Jobber Home Service Trends Report (2026) — home-service response expectations.
- ServiceTitan Call Booking Rate Analysis (2022) — more than 3,000 trade businesses, segmented by size, trade, and daypart.
- 99 Calls Missed-Call Text-Back Study (2026) — 14,354 messages across 192 home-service businesses.
- Hatch Estimate Follow-Up Analysis — HVAC campaign cadence and response context, not plumbing performance.
- Simpro Service Reminder Guide — trade-service reminder timing.
- Housecall Pro Home Service Customer Service Report (2025) — online survey of 1,040 U.S. homeowner decision-makers.
- ServiceTitan Online Booking Research (2024) — contractor-booking preference context.
- Pew Research Center Mobile Fact Sheet (2025) — U.S. cellphone and smartphone access.
- LocaliQ Home Services Search Advertising Benchmarks (2025) — more than 3,200 campaigns running April 2024 through March 2025.
- SearchLight Local Services Ads Benchmarks (2026) — LSA lead cost, booking, and paying-customer data.
- SearchLight Plumbing Google Ads Benchmarks (2026) — plumbing non-branded Search and Performance Max data.
- Think with Google Mobile Speed Research (2017) — historical mobile-load behavior.
- Unbounce Conversion Benchmark Report (2024) — more than 41,000 landing pages, 464 million visitors, and 57 million conversions.
- PwC Future of Customer Experience — cross-industry buying and convenience context.
- Salesforce State of the Connected Customer — cross-industry service-expectation context.
How this page differs from related benchmark reports
This page owns the narrow intent around elapsed response, successful contact, qualification, and the transition to booking. The missed-call report owns answer-rate and call-loss analysis; the CRM statistics report owns system, data, automation, and pipeline measurement; the customer-service report owns the broader service experience; and the email and SMS report owns channel performance and messaging compliance.
Frequently asked questions about plumbing lead response time
As quickly as the company can reliably support, with active flooding, sewage, gas-odor reports, and no-water emergencies triaged first. HubSpot reports that 90% of customers consider an immediate response important and 60% define immediate as ten minutes or less, but those are cross-industry expectations—not a universal plumbing service-level agreement.
Count it as first acknowledgment, not first human response or successful contact. Report the timestamps separately. An instant confirmation is useful only if it sets an honest expectation and routes the inquiry to a named owner who can qualify and book.
There is no universal rate. ServiceTitan reported a 42% typical rate across more than 3,000 trade businesses and a 43% plumbing rate for a named June comparison in its 2022 platform analysis. Compare your rate only after separating qualified opportunities, hours, source, service area, capacity, and job type.
A 2026 study of 14,354 messages across 192 home-service businesses reported a 32.7% reply rate, with 74% of replies arriving within five minutes. It measured replies, not universal plumbing bookings. Test successful contact, qualified-opportunity booking, completion, revenue, opt-outs, and complaints in your own workflow.
Record the original inquiry, acknowledgment, first human response, successful contact, qualification, booking, and completion timestamps. Report median and 90th-percentile response time plus fixed time buckets, counts, qualified-opportunity booking rate, completion, collected revenue, and loss reason by source and daypart.
Blended monthly averages can hide sharp daypart differences. ServiceTitan's analysis showed large-shop booking ranging from 61% at peak to 21% after hours, and small-shop booking from 26% to 9%. Separate evening, overnight, weekend, and holiday performance so the specific handoff can be fixed.
Are good plumbing leads waiting too long for an owner?
We can review the local visibility, landing pages, call paths, forms, and tracking that connect qualified search demand to completed plumbing work.
Run My Free SEO Leak Check