
- The first leak is reachability: only 61% of callers spoke with a person in Invoca's broad call dataset, while reported answer rates varied from 54% to 69% by industry.
- After-hours performance falls hard: ServiceTitan's trade-business analysis showed large-shop booking falling from a 61% peak to 21% after hours; small shops fell from 26% to 9%.
- Recovery can reopen the conversation: a 2026 home-service study reported a 32.7% reply rate to missed-call texts, and 74% of those replies arrived within five minutes.
- Every miss has an acquisition cost: LocaliQ's plumbing paid-search benchmark was $129.02 per lead, while another plumbing dataset put non-branded search at $183 per lead.
- Measure outcomes, not rings: answer rate, qualified-call rate, callback speed, booking rate, completed revenue, and cost per booked job belong on the same report.

Missed plumbing calls are easy to underestimate because most dashboards count the ring as a lead. The customer sees it differently. A burst pipe, failed water heater, or sewer backup creates a short decision window, and the first company to answer clearly may get the work.
This guide organizes 78 numbered missed-call and call-handling statistics from more than 15 source records. Plumbing-only data is rare, so every table labels its scope: plumbing, home services, multiple trades, or broader consumer behavior. The figures are useful benchmarks, not a universal promise for one company or market.
- Do not call a ring, voicemail, or short spam call a qualified lead.
- Separate business hours, lunch, overflow, nights, weekends, and holidays.
- Compare live answer and recovered calls with the same definition each week.
- Connect source, call disposition, booking, completed job, and revenue.
- Use external benchmarks to investigate—not to grade employees without context.
What counts as a missed plumbing call?
A missed call is an inbound call that does not reach a person capable of owning the next step. That includes unanswered rings, calls abandoned in a queue, calls routed to a full voicemail box, calls that hit a closed message with no recovery path, and calls transferred into nowhere. A recovered missed call is one that later reaches a qualified customer and receives a documented disposition.
A practical lead-tracking system for plumbers preserves this chain. If the report stops at calls, a bad phone process can make successful marketing look like failure—or make weak marketing look better than it is.
1. Call answer, qualification, and conversion statistics
Invoca's 2025 call-performance reporting used more than 60 million calls. The home-services conversion benchmark is relevant to plumbing, while the answer, qualification, quality, and industry comparisons are broader. They describe different stages and should not be multiplied into one synthetic funnel.
| # | Call benchmark | Value | Source | Scope |
|---|---|---|---|---|
| 1 | Calls included in the performance analysis | 60M+ | Invoca via Supply House Times, 2025 | Multi-industry dataset size |
| 2 | Callers who spoke with a person | 61% | Invoca, 2025 | Cross-industry |
| 3 | Range in call answer rates | 54%–69% | Invoca, 2025 | Range across measured industries |
| 4 | Digital-marketing calls that were qualified leads | 35% | Invoca, 2025 | Cross-industry |
| 5 | High-end lead rate reported for some industries | 54% | Invoca, 2025 | Industry high end |
| 6 | Phone leads converting during the call | 37% | Invoca, 2025 | Cross-industry |
| 7 | Home-services phone leads converting during the call | 46% | Invoca, 2025 | Multiple home-service trades |
| 8 | Calls rated excellent by contact-center managers | 28% | Invoca, 2025 | Manager rating |
| 9 | Agents who asked the lead to buy or book | 35% | Invoca, 2025 | Observed call behavior |
| 10 | Automotive phone-lead conversion | 42% | Invoca, 2025 | Industry comparison |
| 11 | Business-services phone-lead conversion | 22% | Invoca, 2025 | Industry comparison |
| 12 | Consumer-services phone-lead conversion | 36% | Invoca, 2025 | Industry comparison |
| 13 | Healthcare phone-lead conversion | 40% | Invoca, 2025 | Industry comparison |
| 14 | Senior-care phone-lead conversion | 41% | Invoca, 2025 | Industry comparison |
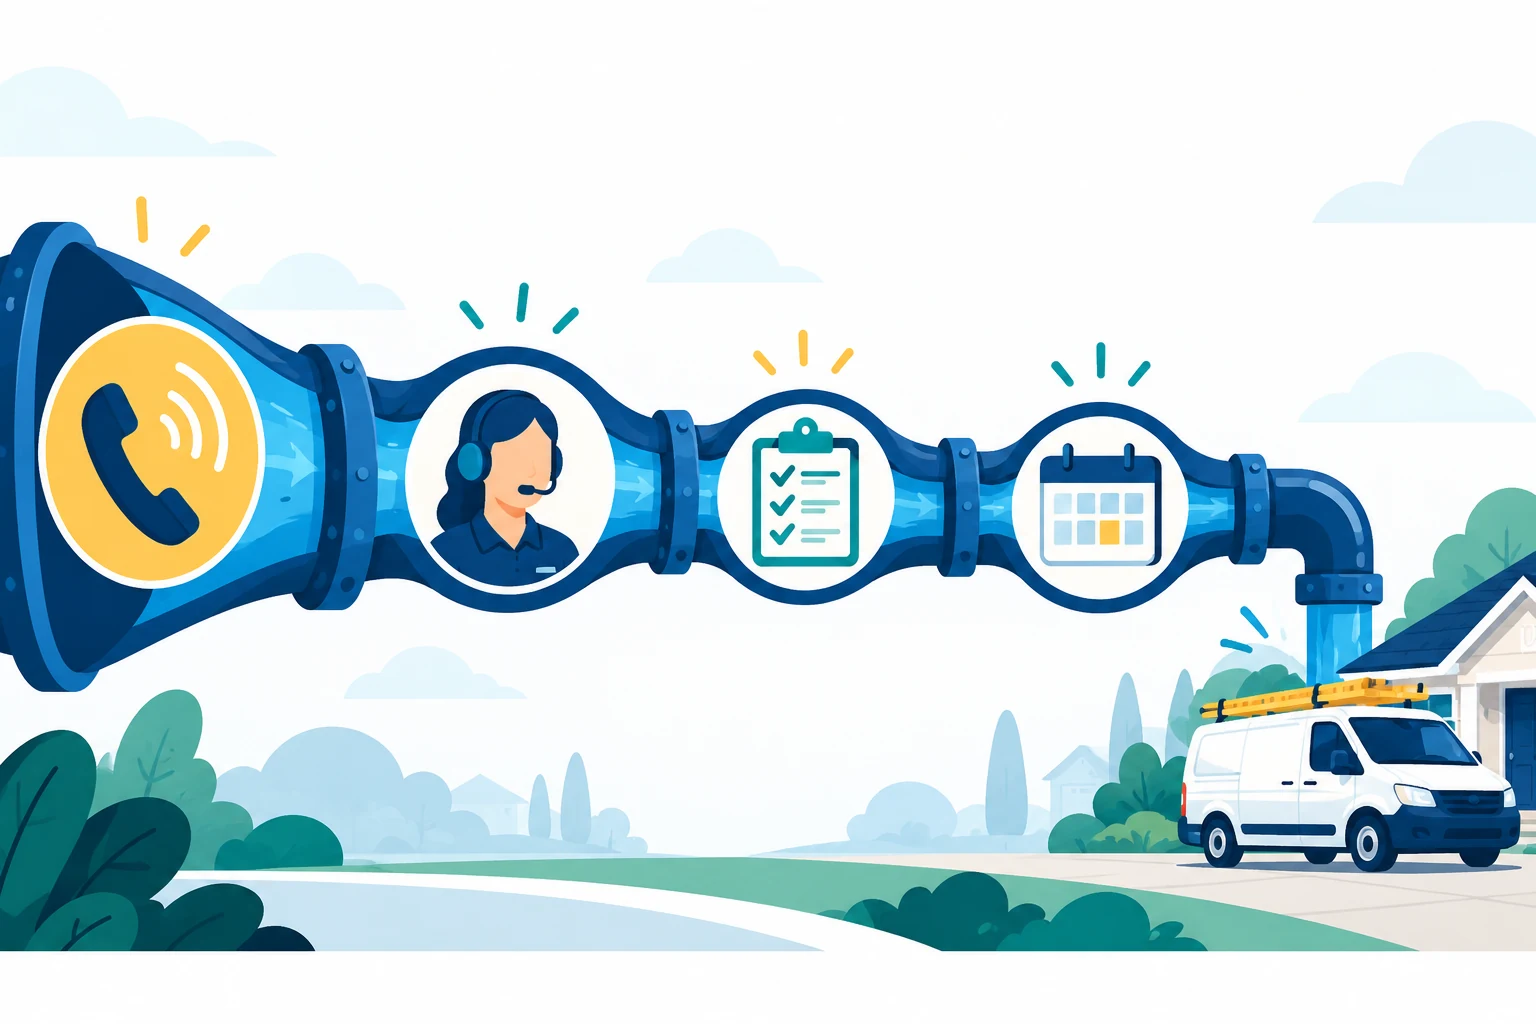
Once routing works, call quality matters. Review whether the CSR states the company name, confirms the issue and location, checks urgency, offers a real appointment, handles a transfer cleanly, and records the outcome. The broader plumbing customer-service statistics guide covers the rest of that experience.
2. Booking-rate and after-hours missed-call statistics
ServiceTitan's 2022 platform analysis covered more than 3,000 trade businesses. It is older and platform-specific, but it is unusually useful because it separates business size, trade, and time of day. A booking rate is not an answer rate: it measures calls turned into appointments under the source's definitions.
| # | Booking benchmark | Value | Source | Scope |
|---|---|---|---|---|
| 15 | Typical call-booking rate | 42% | ServiceTitan, 2022 | Trade businesses |
| 16 | Businesses included in the analysis | 3,000+ | ServiceTitan, 2022 | Platform dataset |
| 17 | Booking rate for businesses with 25+ technicians | 59% | ServiceTitan, 2022 | Large-shop cohort |
| 18 | Booking rate for businesses with fewer than five technicians | 24% | ServiceTitan, 2022 | Small-shop cohort |
| 19 | Plumbing June booking rate | 43% | ServiceTitan, 2022 | Plumbing; named-month comparison |
| 20 | Electrical June booking rate | 41% | ServiceTitan, 2022 | Trade comparison |
| 21 | HVAC June booking rate | 38% | ServiceTitan, 2022 | Trade comparison |
| 22 | Garage-door and water-treatment booking rate | 31% | ServiceTitan, 2022 | Trade comparison |
| 23 | Large-shop peak booking rate | 61% | ServiceTitan, 2022 | Time-of-day high |
| 24 | Large-shop after-hours booking rate | 21% | ServiceTitan, 2022 | Time-of-day low |
| 25 | Small-shop peak booking rate | 26% | ServiceTitan, 2022 | Time-of-day high |
| 26 | Small-shop after-hours booking rate | 9% | ServiceTitan, 2022 | Time-of-day low |
| 27 | Year-over-year monthly booking-rate lift | 2%–5% | ServiceTitan, 2022 | 2022 versus 2021 |
| 28 | Top-company booking-rate example | 77% | ServiceTitan, 2022 | Top-25 company range cited |
| 29 | Best-practice booking target described as attainable | 90% | ServiceTitan, 2022 | Expert target, not observed average |
| 30 | Illustrative annual revenue tied to a five-point booking lift | About $100K | ServiceTitan, 2022 | Businesses with 5–14 technicians |
ServiceTitan's large-shop booking range fell sharply from its peak to after-hours performance. The comparable small-shop range was 26% to 9%. That is why one blended monthly booking rate can hide the most expensive hours.
What to do: report weekday office hours, lunch, dispatch overflow, evenings, overnight, weekends, and holidays separately. If an answering service takes the call, measure transfer success and actual bookings—not only “messages taken.” For the operating workflow, use our five-step missed-call recovery guide.
3. Missed-call recovery and response-speed statistics
Recovery data requires careful labeling. The 99 Calls study examined 14,354 automated messages across 192 home-service businesses; it did not measure universal plumbing booking rates. Nextiva's figures are directional estimates. Jobber and HubSpot describe stated expectations rather than observed emergency-plumbing behavior.
| # | Recovery or response benchmark | Value | Source | Scope |
|---|---|---|---|---|
| 31 | Missed-call text messages analyzed | 14,354 | 99 Calls, 2026 | Study sample |
| 32 | Home-service businesses represented | 192 | 99 Calls, 2026 | Study sample |
| 33 | Reply rate to missed-call text-back messages | 32.7% | 99 Calls, 2026 | Home services; replies, not bookings |
| 34 | Text-back replies arriving within five minutes | 74% | 99 Calls, 2026 | Among replies |
| 35 | Callers cited as unlikely to leave voicemail after no answer | 82% | Nextiva | Directional benchmark |
| 36 | Directional value of an inbound home-services call | $300–$400 | Nextiva | Estimate, not a plumbing guarantee |
| 37 | Estimated paid-channel ROI loss tied to poor call handling | 30% | Nextiva | Directional estimate |
| 38 | Customers rating an immediate response important or very important | 90% | HubSpot | Cross-industry survey context |
| 39 | Customers defining “immediate” as 10 minutes or less | 60% | HubSpot | Cross-industry survey context |
| 40 | Home-service customers expecting a same-day response | Over 70% | Jobber, 2026 | Home-service research |
| 41 | Home-service customers expecting a response within an hour | More than half | Jobber, 2026 | Home-service research |
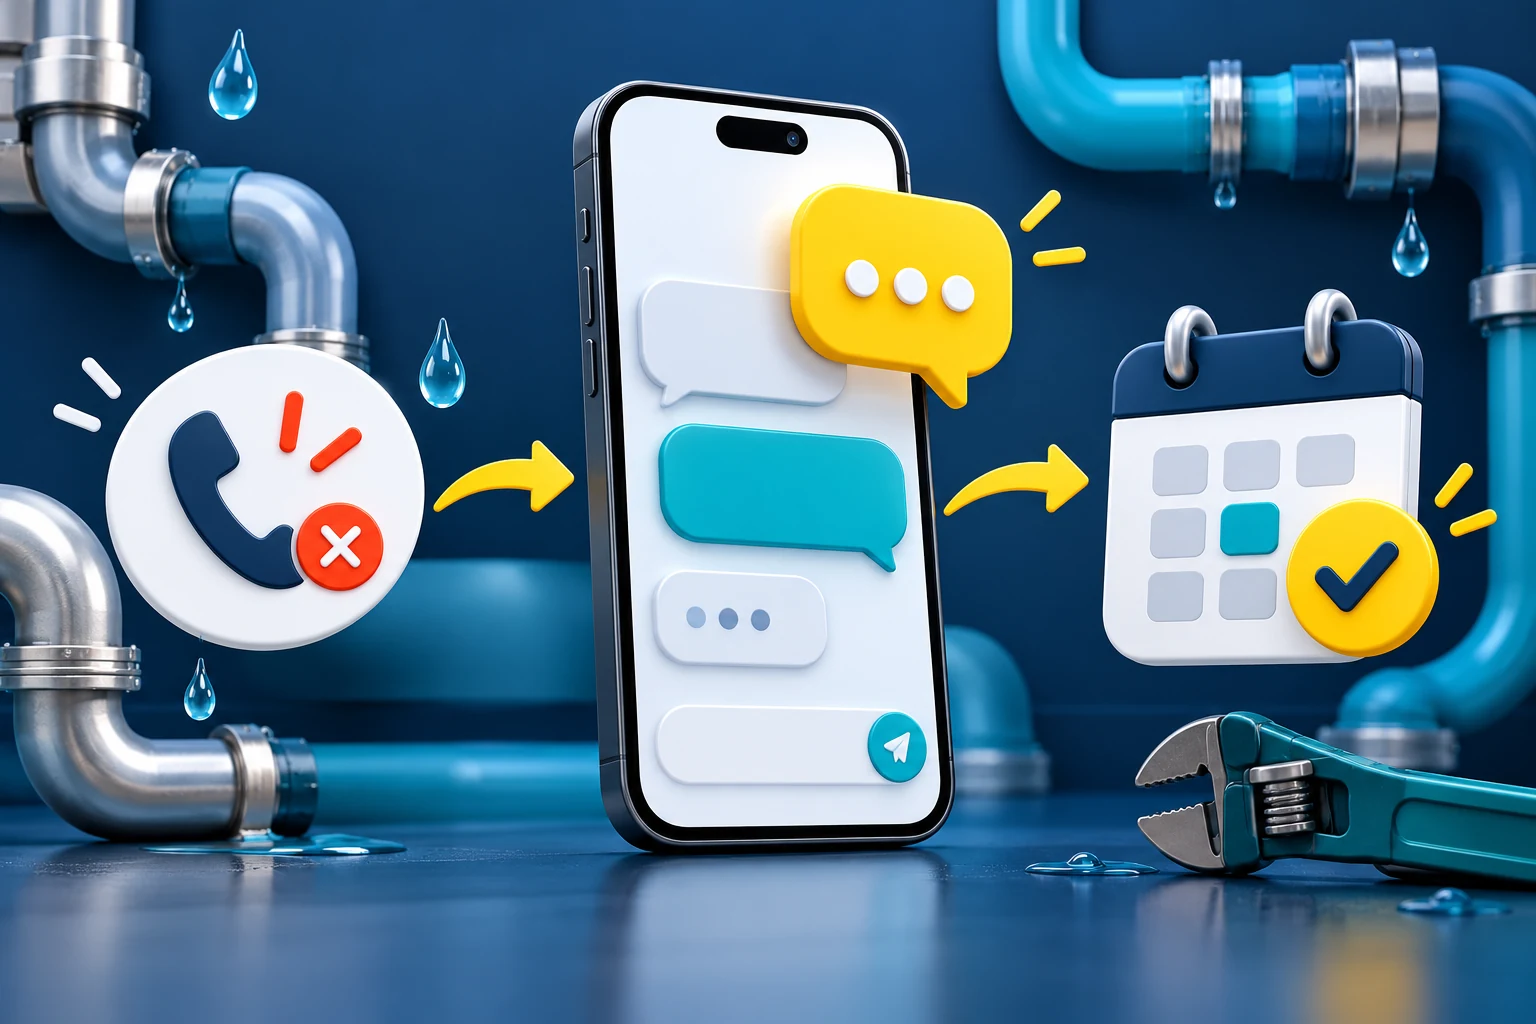
A useful first message names the company, acknowledges the missed call, asks one short question about the issue or location, and states what happens next. Do not force the customer through a bot maze. Route urgent words—active flooding, sewage, gas odor, no water—to a human escalation path.
4. Paid lead cost and missed-call economics
The cost of a missed call starts upstream. LocaliQ's dataset covered more than 3,200 home-services search campaigns from April 2024 through March 2025. SearchLight's 2026 datasets use different contractor samples and campaign definitions. Keep each source intact rather than blending the figures into one “average plumbing lead cost.”
| # | Lead-economics benchmark | Value | Source | Scope |
|---|---|---|---|---|
| 42 | Plumbing paid-search click-through rate | 4.97% | LocaliQ, 2025 | Plumbing search campaigns |
| 43 | Plumbing paid-search cost per click | $10.49 | LocaliQ, 2025 | Plumbing search campaigns |
| 44 | Plumbing paid-search conversion rate | 7.63% | LocaliQ, 2025 | Configured conversions |
| 45 | Plumbing paid-search cost per lead | $129.02 | LocaliQ, 2025 | Not cost per booking |
| 46 | All-home-services cost per lead | $90.92 | LocaliQ, 2025 | Matched home-services dataset |
| 47 | Home-services Local Services Ads cost per lead | $53 | SearchLight, 2026 | Home services |
| 48 | Local Services Ads booking rate | 43.9% | SearchLight, 2026 | Dataset average |
| 49 | Local Services Ads cost per paying customer | $233 | SearchLight, 2026 | Dataset average |
| 50 | Local Services Ads average ticket | $1,826 | SearchLight, 2026 | Home services |
| 51 | Local Services Ads closed return on ad spend | 7.84× | SearchLight, 2026 | Dataset average |
| 52 | Drain and sewer Local Services Ads booking rate | 39.5% | SearchLight, 2026 | Service category |
| 53 | Drain and sewer Local Services Ads cost per lead | $59 | SearchLight, 2026 | Service category |
| 54 | Drain and sewer Local Services Ads ROAS | 5.50× | SearchLight, 2026 | Service category |
| 55 | Plumbing non-branded search cost per lead | $183 | SearchLight, 2026 | Plumbing campaign dataset |
| 56 | Median non-branded cost per paying customer | $333 | SearchLight, 2026 | Plumbing campaign dataset |
| 57 | Plumbing Performance Max cost per lead | $82 | SearchLight, 2026 | Plumbing campaign dataset |
| 58 | Plumbing Performance Max closed ROAS | 5.54× | SearchLight, 2026 | Plumbing campaign dataset |
A $53, $129, or $183 lead that reaches voicemail is not merely “missed.” It is paid demand handed back to the market. Review our plumber cost-per-lead benchmarks and Google Ads statistics for plumbers with answer rate and booked-job cost on the same screen.
5. Mobile, website, and digital-intake statistics
The phone remains important, but callers increasingly move between maps, reviews, a website, online booking, and text. Pew measures device ownership. Housecall Pro and ServiceTitan report homeowner expectations. These figures describe access and preference—not plumbing call volume.
| # | Digital-intake benchmark | Value | Source | Scope |
|---|---|---|---|---|
| 59 | Consumers reported as expecting online booking | 70% | ServiceTitan, 2024 | Contractor booking context |
| 60 | New-contractor shoppers more likely to choose online booking | 94% | ServiceTitan, 2024 | Stated likelihood |
| 61 | Homeowner decision-makers surveyed | 1,040 | Housecall Pro, 2025 | U.S. survey sample |
| 62 | Homeowners factoring online booking into provider choice | 80% | Housecall Pro, 2025 | Provider choice |
| 63 | Homeowners expecting a professional, user-friendly website | 96% | Housecall Pro, 2025 | Website expectation |
| 64 | Homeowners comfortable with AI handling initial inquiries | 53% | Housecall Pro, 2025 | Initial inquiry only |
| 65 | U.S. adults owning a smartphone | 91% | Pew Research Center, 2025 | U.S. adults |
| 66 | U.S. adults owning any cellphone | 98% | Pew Research Center, 2025 | U.S. adults |
| 67 | U.S. adults who are smartphone-only internet users | 16% | Pew Research Center, 2025 | No home broadband |
| 68 | Mobile visitors leaving pages that took over three seconds | 53% | Think with Google, 2017 | Historical mobile research |
| 69 | Landing pages in conversion benchmark | 41,000+ | Unbounce, 2024 | Cross-industry dataset |
| 70 | Unique visitors in conversion benchmark | 464M | Unbounce, 2024 | Cross-industry dataset |
What this means for plumbers: provide more than one dependable intake path. Keep click-to-call obvious on urgent service pages, offer a short form or scheduler for planned work, and route every digital request to a monitored queue. A voicemail box is not an after-hours strategy, and an unmonitored booking notification is just voicemail wearing a nicer shirt.
6. Review, trust, and customer-loyalty statistics
A missed call can send the homeowner back to the search results, where reviews influence the second choice. BrightLocal's 2026 survey covers U.S. local-consumer behavior, while PwC's customer-experience study is broader and older. Neither is a plumbing-only call study, but both help explain the stakes of an unresolved contact failure.
| # | Trust or loyalty benchmark | Value | Source | Scope |
|---|---|---|---|---|
| 71 | Consumers who read reviews for local businesses | 97% | BrightLocal, 2026 | U.S. local consumers |
| 72 | Consumers who care about star ratings | 92% | BrightLocal, 2026 | U.S. local consumers |
| 73 | Consumers only willing to use businesses with four stars or more | 68% | BrightLocal, 2026 | Rating threshold |
| 74 | Consumers focused on reviews from the last three months | 74% | BrightLocal, 2026 | Review recency |
| 75 | Consumers visiting the website after positive reviews | 54% | BrightLocal, 2026 | Post-review action |
| 76 | Consumers saying experience is an important buying factor | 73% | PwC | Cross-industry |
| 77 | Consumers who would leave a loved brand after one bad experience | 32% | PwC | Cross-industry |
| 78 | Consumers willing to pay more for greater convenience | 43% | PwC | Cross-industry |
A calm recovery can still protect trust: identify the company, own the delay, give a real next update, and do what was promised. If the missed call becomes a public complaint, respond to the actual experience rather than defending the phone system. Use a plumbing lead CRM to keep callbacks from becoming invisible sticky notes.

Build a missed-call scorecard that leads to action
A 78-statistics report can clarify the outside landscape, but the company's own call records decide what to fix. Keep the weekly scorecard short enough that the owner, CSR lead, dispatcher, and marketing manager will review it together.
1Demand
Track unique inbound callers, total attempts, source, service requested, service area, first-time versus repeat customer, and business-hours segment.
2Reachability
Track live answer rate, abandonment, voicemail, answering-service pickup, overflow transfers, and the specific routing point where each call failed.
3Recovery
Track first callback time, first text time, customer reply, successful human contact, recovery within 5, 15, 30, and 60 minutes, and final disposition.
4Qualification
Tag spam, duplicate, wrong area, wrong service, price-only inquiry, existing customer, qualified opportunity, and true emergency separately.
5Booking
Track booking ask, appointment offered, appointment booked, reason lost, cancellation, dispatch, completion, and collected revenue.
6Economics
Report cost per qualified call, cost per booking, cost per completed job, gross profit, and recovered revenue by SEO, ads, LSA, maps, and referral source.
A practical weekly call review
- Listen to five calls: one strong booking, one missed call, one recovered call, one lost qualified lead, and one complaint.
- Break answer and booking rates into office hours, after hours, weekends, and source.
- Find the first recurring failure: ring duration, transfer, script, schedule access, service-area check, or no booking ask.
- Assign one owner and one deadline for the fix.
- Check the next week's booked and completed outcomes before changing another part of the funnel.
The plumber's guide to marketing ROI explains how to connect these operating rates to gross profit. More leads are not the first answer when the calls already being generated are not reaching the schedule.
Methodology and source notes
This article was published October 21, 2026. We prioritized large call datasets, trade-software analyses, home-service research, first-party benchmark reports, established consumer surveys, and sources with identifiable methodologies. The 78 numbered entries retain each source's scope. Derived complements and cross-source multiplication were excluded from the numbered tables.
Public plumbing-only missed-call research is limited. “Home services” can include HVAC, electrical, roofing, and other trades; “trade businesses” may reflect a software platform's customer base; cross-industry customer research is context rather than a plumbing average. Company call recordings, phone-system logs, CRM dispositions, dispatch records, invoices, and collected revenue remain the final benchmark.
- Invoca call benchmarks via Supply House Times (2025) — performance reporting based on more than 60 million calls.
- ServiceTitan Call Booking Rate Analysis (2022) — platform data from more than 3,000 trade businesses.
- 99 Calls Missed-Call Text-Back Study (2026) — 14,354 messages across 192 home-service businesses.
- Nextiva Missed-Call Cost Analysis — directional voicemail, call-value, and ROI-loss estimates.
- HubSpot Customer Service Statistics — cross-industry response expectations.
- Jobber Home Service Trends Report (2026) — home-service business and customer-response context.
- LocaliQ Home Services Search Advertising Benchmarks (2025) — more than 3,200 campaigns running April 2024 through March 2025.
- SearchLight Local Services Ads Benchmarks (2026) — home-service LSA cost, booking, customer, ticket, and ROAS data.
- SearchLight Plumbing Google Ads Benchmarks (2026) — plumbing non-branded Search and Performance Max data.
- ServiceTitan Online Booking Research (2024) — contractor-booking preference context.
- Housecall Pro Home Service Customer Service Report (2025) — online survey of 1,040 U.S. homeowner decision-makers.
- Pew Research Center Mobile Fact Sheet (2025) — U.S. cellphone and smartphone ownership.
- Think with Google Mobile Speed Research (2017) — historical mobile-load behavior.
- Unbounce Conversion Benchmark Report (2024) — more than 41,000 landing pages, 464 million visitors, and 57 million conversions.
- BrightLocal Local Consumer Review Survey (2026) — U.S. local-review behavior and trust thresholds.
- PwC Future of Customer Experience — cross-industry buying, convenience, and loyalty research.
Frequently asked questions
There is no universal plumbing answer-rate benchmark. Invoca reported a 54% to 69% range across industries and found 61% of callers reached a person in its broad dataset. Measure your own unique callers by business hours, after hours, source, service, and qualified status.
Do not use a universal dollar figure. Estimate loss from qualified missed opportunities multiplied by your recovered or comparable booking rate, completion rate, average collected revenue, and gross margin. Exclude spam, duplicates, wrong-area calls, and poor-fit work.
A 2026 study of 14,354 messages across 192 home-service businesses reported a 32.7% reply rate, with 74% of replies arriving within five minutes. That measures replies, not booked plumbing jobs. Test compliant text-back against your own successful contact, booking, and completed-job rates.
Time-of-day performance can differ sharply. ServiceTitan's trade-business analysis showed large-shop booking ranging from 61% at peak to 21% after hours, and small-shop booking from 26% to 9%. A blended monthly number can hide that operational leak.
Track unique inbound callers, live answer, abandonment, callback speed, text reply, successful recovery, qualification, booking ask, appointment, completion, collected revenue, and gross profit by source, service, and time period.
Use the option that reliably creates owned next steps. A trained live service may be valuable when it can qualify, transfer, or book correctly. If it only takes messages, measure callback speed and actual bookings. Voicemail should have a monitored recovery path and should not be the only option for urgent calls.
Are good plumbing leads leaking after the ring?
We can review the local visibility, call paths, service pages, and tracking that connect search demand to booked plumbing work.
Run My Free SEO Leak Check