
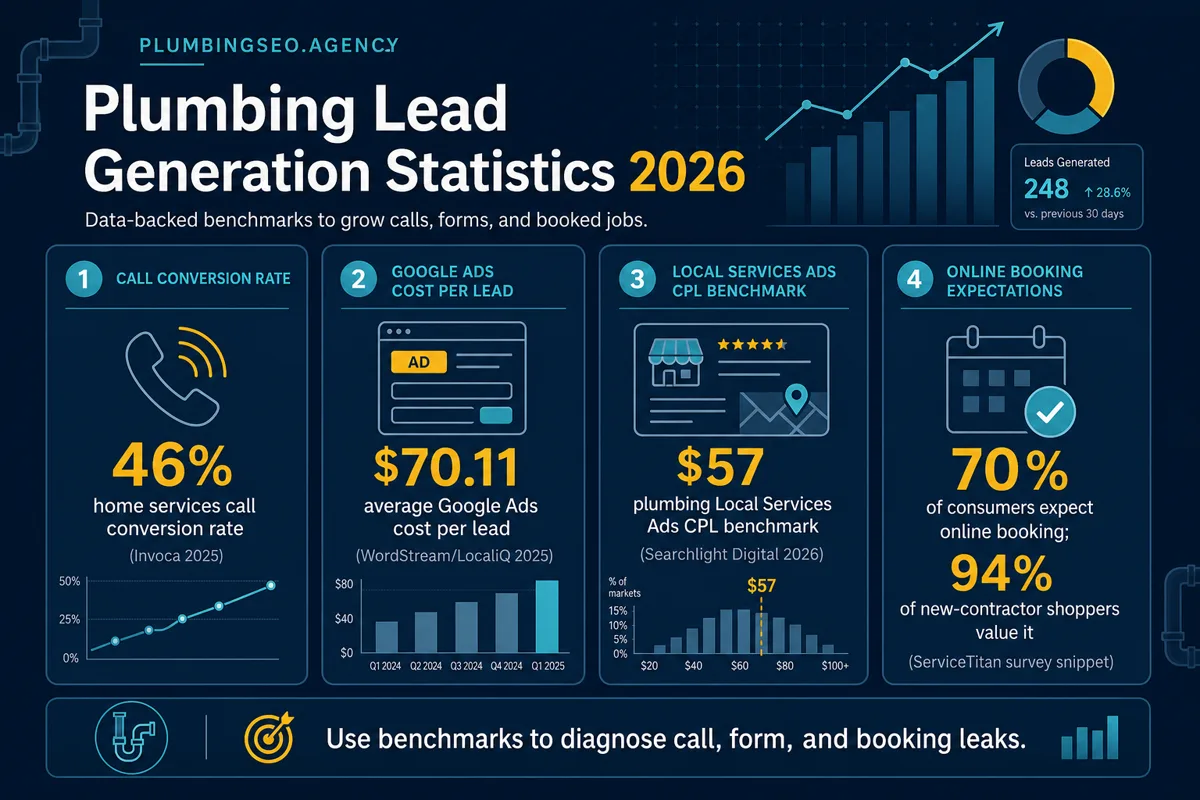
- Call handling is the biggest controllable leak: home services calls convert around 46%, but ServiceTitan data shows typical trade shops book only 42% of calls and small shops can sit near 24%.
- Paid lead costs vary widely: one 2026 plumbing dataset puts non-branded search at $183 per lead while home services LSA averages $53, so downstream booking and sold-job economics matter more than CPL alone.
- Trust and speed decide who gets booked: 97% of consumers read local reviews, more than 70% expect same-day response, and 70% expect online booking.
Plumbing lead generation statistics are only useful when they help an owner make a better weekly decision: answer faster, book more of the calls already paid for, tighten the channel mix, or stop funding leads that never turn into revenue. This roundup organizes 100+ current benchmarks into a practical scorecard for calls, forms, Local Services Ads, Google Ads, reviews, booking, and demand planning.
Use the numbers below as outside benchmarks, not excuses. A drain-cleaning company with a strong dispatcher, fast response, and fresh reviews can beat the average. A company with missed calls, stale reviews, and slow form follow-up can lose money even when its cost per lead looks “cheap.”
1. Paid Search Cost-Per-Lead Benchmarks
Paid search is where plumbing owners often feel the pain first because every click and call has a visible cost. The useful comparison is not “Google Ads good or bad”; it is branded versus non-branded, search versus PMax, and lead cost versus booked-and-sold customer cost. If your campaigns are drifting above the bottom-quartile CPL range, check keyword intent, service-area targeting, landing-page speed, form friction, and call tracking before simply raising budget.
| Benchmark | Value | How to use it |
|---|---|---|
| Dataset size | $14.6M | Non-branded Google Ads spend tracked across plumbing contractors. [1] |
| Contractor sample | 524 contractors | Sample behind plumbing Google Ads CPL benchmarks. [1] |
| Campaign sample | 2,554 campaigns | Non-branded and PMax campaigns in the benchmark. [1] |
| Non-branded search CPL | $183 | Average plumbing non-branded search cost per lead. [1] |
| Median cost per paying customer | $333 | Median spend needed to acquire one paying customer from non-branded campaigns. [1] |
| PMax CPL | $82 | Performance Max plumbing cost per lead in the sample. [1] |
| PMax discount vs non-brand | 55% lower | PMax lead cost compared with non-branded search in the dataset. [1] |
| Median PMax spend | $1,856/month | Median monthly plumbing PMax spend among adopters. [1] |
| PMax ROAS | 5.54x | Closed ROAS reported for PMax. [1] |
| Non-branded ROAS | 2.58x | Closed ROAS reported for non-branded search. [1] |
| Typical total Google Ads spend | $14,206/month | Typical contractor spend across trades and campaign types. [1] |
| Plumbing budget allocation | 40% | Approximate share of total Google Ads budget allocated to plumbing-specific campaigns. [1] |
| Spend mix: plumbing | 32% | Share of full dataset Google Ads spend attributed to plumbing campaigns. [1] |
| Spend mix: HVAC | 30% | Share of full dataset spend attributed to HVAC campaigns. [1] |
| Spend mix: electrical | 6% | Share of full dataset spend attributed to electrical campaigns. [1] |
| Spend mix: other/branded/general | 32% | Remaining share of full dataset spend. [1] |
| Top-quartile non-brand CPL | Below $107 | Benchmark for strong non-branded plumbing CPL. [1] |
| Bottom-quartile non-brand CPL | Above $253 | Benchmark indicating likely optimization opportunity. [1] |
| 10th percentile non-brand CPL | $77 | Low-end benchmark in the distribution. [1] |
| 90th percentile non-brand CPL | $396 | High-end benchmark in the distribution. [1] |
| CPL spread | 5x | Spread from 10th to 90th percentile. [1] |
For owners building a long-term acquisition mix, paid search should work alongside plumbing SEO, Google Business Profile optimization, retargeting, and review generation. Paid channels can fill urgent calendar gaps, while organic visibility reduces dependence on auction inflation over time.
2. Google Local Services Ads Benchmarks
Local Services Ads are usually closer to the phone call than a traditional search ad, but they still need operational discipline. SearchLight’s LSA dataset shows why cost per lead can be misleading: two companies can pay the same $55 for a lead and end up with radically different cost per customer and ROAS because booking rate, match rate, and average ticket differ.
| Benchmark | Value | How to use it |
|---|---|---|
| Dataset spend | $6.72M | Home Services LSA spend tracked in February 2026. [2] |
| Contractor sample | 888 contractors | Sample behind LSA benchmarks. [2] |
| Lead sample | 126,650 leads | Lead volume behind the LSA dataset. [2] |
| Home services LSA CPL | $53 | Average home services Local Services Ads cost per lead. [2] |
| LSA book rate | 43.9% | Average rate at which LSA leads booked. [2] |
| LSA cost per paying customer | $233 | Average cost per paying customer in the LSA dataset. [2] |
| LSA average ticket | $1,826 | Average ticket in the LSA dataset. [2] |
| LSA closed ROAS | 7.84x | Closed return on ad spend across the dataset. [2] |
| Electrical LSA CPL | $39 | Lowest service-category lead cost in the cited dataset. [2] |
| Electrical LSA ROAS | 8.52x | Closed ROAS for electrical LSA campaigns. [2] |
| Electrical average ticket | $1,434 | Average ticket for electrical LSA campaigns. [2] |
| Electrical book rate | 43.4% | Book rate for electrical LSA campaigns. [2] |
| HVAC LSA CPL | $51 | Average CPL for HVAC LSA leads. [2] |
| HVAC LSA ROAS | 9.55x | Highest ROAS among cited service categories. [2] |
| HVAC average ticket | $2,110 | HVAC LSA average ticket. [2] |
| General/all-trades spend | $2.51M | Spend in general/all-trades LSA campaigns. [2] |
| General/all-trades accounts | 464 accounts | Accounts in the general/all-trades category. [2] |
| General/all-trades share | 37.3% | Share of total LSA spend. [2] |
| General/all-trades CPL | $54 | CPL for blended all-trades campaigns. [2] |
| Drain/sewer book rate | 39.5% | Lowest book rate in the cited major categories. [2] |
| Drain/sewer CPL | $59 | Drain/sewer LSA cost per lead. [2] |
| Drain/sewer ROAS | 5.50x | Weakest ROAS among cited major categories. [2] |
| Contractor A book rate | 48% | Example showing profitable economics with the same $55 CPL. [2] |
| Contractor A average ticket | $2,800 | Example ticket size. [2] |
| Contractor A match rate | 45% | Example CRM match rate. [2] |
| Contractor A cost per customer | $180 | Example cost per paying customer. [2] |
| Contractor A ROAS | 15.6x | Example high-return economics. [2] |
| Contractor B book rate | 30% | Example showing poor economics with the same $55 CPL. [2] |
| Contractor B average ticket | $1,200 | Example lower ticket. [2] |
| Contractor B match rate | 25% | Example lower match rate. [2] |
| Contractor B cost per customer | $440 | Example higher customer acquisition cost. [2] |
| Contractor B ROAS | 2.7x | Example lower return economics. [2] |
| LSA vs blended Google Ads | 49% less expensive | LSA CPL compared with blended Google Ads CPL. [2] |
| LSA vs non-brand Google Ads | 64% less expensive | LSA CPL compared with non-branded Google Ads. [2] |
| Non-brand Google Ads book rate | 37.6% | Comparison benchmark for non-branded Google Ads. [2] |
3. Call and Booking Benchmarks
For plumbers, the call is often the conversion event that matters. Invoca’s call-performance data and ServiceTitan’s booking-rate data point to the same operational lesson: marketing is wasted when callers do not reach a trained person who asks for the appointment.
| Benchmark | Value | How to use it |
|---|---|---|
| Call dataset | 60M+ calls | Calls analyzed in the call conversion benchmark report. [3] |
| Callers reaching a person | 61% | Share of business callers who speak with a person. [3] |
| Answer-rate range | 54%-69% | Range of answer rates across industries. [3] |
| Qualified digital call leads | 35% | Calls from digital marketing that are qualified leads. [3] |
| High-end lead rate | 54% | Lead rates can reach this level in certain industries. [3] |
| Phone leads converting during call | 37% | Share of phone leads converting during the call. [3] |
| Home services conversion rate | 46% | Home services benchmark conversion rate. [3] |
| Excellent call rating | 28% | Calls rated excellent by contact center managers. [3] |
| Agents asking for booking/purchase | 35% | Agents who ask leads to purchase or book appointments. [3] |
| Automotive conversion | 42% | Industry comparison benchmark. [3] |
| Business services conversion | 22% | Industry comparison benchmark. [3] |
| Consumer services conversion | 36% | Industry comparison benchmark. [3] |
| Financial services conversion | 29% | Industry comparison benchmark. [3] |
| Healthcare conversion | 40% | Industry comparison benchmark. [3] |
| Senior care conversion | 41% | Industry comparison benchmark. [3] |
| Typical trade booking rate | 42% | Typical shop call booking rate in the 2022 ServiceTitan data. [4] |
| Booking gain revenue impact | $100,000 | Revenue impact associated with a 5% booking-rate improvement for 5-14 technician companies. [4] |
| Booking gain required | One call in 20 | A 5% lift equals turning one additional call out of 20 into revenue. [4] |
| Best-practice booking target | 90% | Target ServiceTitan experts describe as attainable. [4] |
| Trade business sample | 3,000+ businesses | Aggregated trade-business data sample. [4] |
| Large-shop booking rate | 59% | Booking rate for businesses with 25+ technicians. [4] |
| Small-shop booking rate | 24% | Booking rate for businesses with fewer than five technicians. [4] |
| Large-shop peak vs after-hours | 61% to 21% | Time-of-day range for larger businesses. [4] |
| Small-shop peak vs after-hours | 26% to 9% | Time-of-day range for smaller businesses. [4] |
| Year-over-year booking lift | 2%-5% | Rates were higher each month of 2022 compared to 2021. [4] |
| Plumbing June booking rate | 43% | Plumbing had the highest average June booking rate among named trades. [4] |
| Electrical June booking rate | 41% | Electrical benchmark. [4] |
| HVAC June booking rate | 38% | HVAC benchmark. [4] |
| Garage/water treatment booking rate | 31% | Garage door and water treatment benchmark. [4] |
| Top-company booking range | 77% | Top 25 company example range cited by ServiceTitan. [4] |
Quick diagnostic for plumber owners
If you do not know your answer rate, qualified-call rate, booking rate, and booked-job revenue by source, fix measurement before adding another lead vendor. Start with one week of call classification and compare it with booked jobs in your CRM.
4. Forms and Online Booking Expectations
Phone calls still dominate urgent plumbing demand, but online booking expectations are now high enough that a weak form or scheduler can cost jobs. The practical target is not “more forms”; it is fast routing, accurate availability, and a booking CTA on the service pages that already receive intent.
| Benchmark | Value | How to use it |
|---|---|---|
| Consumers expecting online booking | 70% | Consumers expecting online booking. [5] |
| New-contractor shoppers favor online booking | 94% | Consumers looking for a new contractor are more likely to choose one offering online booking. [5] |
| Online appointments booked | 500,000+ | Scheduling users booked this many appointments in the first three quarters of 2023. [5] |
| Revenue from online appointments | $30M+ | Revenue generated by those booked appointments. [5] |
| Dispatch scan cadence | Every 10 minutes | Dispatch Pro scans for unbooked jobs on this cadence. [5] |
5. Reviews, Demand, and Labor Context
Lead generation does not happen in a vacuum. Reviews decide whether the lead trusts you, response speed decides whether you get the appointment, and capacity decides whether demand turns into revenue. The following context benchmarks help owners decide whether to push harder on lead volume or first repair trust, staffing, and booking operations.
Home service growth and speed-to-lead
| Benchmark | Value | How to use it |
|---|---|---|
| Business-owner survey | 1,000+ owners | U.S. home service owner survey sample. [6] |
| Expect revenue growth | 75% | Home service businesses expecting revenue growth in 2026. [6] |
| Expect significant revenue jump | 1 in 5 | Businesses forecasting a significant jump. [6] |
| High-confidence businesses raised prices | 91% | High-confidence businesses that raised prices. [6] |
| High-confidence pricing confidence | 93% | High-confidence businesses confident in pricing. [6] |
| High-confidence quote close | Nearly 90% | High-confidence businesses closing more than half their quotes. [6] |
| Same-day response expectation | Over 70% | Customers expecting same-day response. [6] |
| One-hour response expectation | More than half | Customers expecting response within the hour. [6] |
| Workmanship satisfaction driver | 69% | Customers naming workmanship as critical. [6] |
| Clear communication driver | 32% | Customers naming communication as critical. [6] |
| Professional behavior driver | 31% | Customers naming professional behavior as critical. [6] |
| Referral lead volume | 59% | Referrals still dominate lead volume. [6] |
| Google lead channel | 20% | Google lead generation channel share reported for high performers. [6] |
| Facebook lead channel | 32% | Facebook lead generation channel share reported for high performers. [6] |
| LSA lead channel | 19% | Local Services Ads channel share reported for high performers. [6] |
| High-confidence AI adoption | 88% | High-confidence businesses using AI. [6] |
| Low-confidence AI adoption | 27% | Low-confidence peer AI adoption. [6] |
| Under-30 AI adoption | 64% | Pros under 30 already using AI. [6] |
| Demand increased | Nearly 60% | Pros reporting increased customer demand last year. [6] |
| Significant demand jump | 16% | Among those seeing demand increase, share seeing significant jump. [6] |
| Under-30 demand increase | 75% | Business owners under 30 reporting increased demand. [6] |
| Under-30 significant demand jump | 1 in 4 | Under-30 owners seeing a significant spike. [6] |
| High-revenue significant demand jump | 23% | Businesses over $500K reporting significant demand growth. [6] |
| Fully booked or close | 80% | Service businesses fully booked or close. [6] |
| Trouble filling schedules | 3% | Businesses reporting trouble filling schedules. [6] |
| Seasonality not scheduling | 1% | Businesses not scheduling due to seasonality. [6] |
| Growing/established booked | 90%+ | Growing and established businesses booked solid or only occasional gaps. [6] |
| Newer businesses with gaps | 40%+ | Newer businesses with open availability or difficulty filling calendars. [6] |
| Consumers reading reviews | 97% | Consumers reading reviews for local businesses. [7] |
| Always read reviews | 41% | Consumers always reading reviews when browsing businesses. [7] |
| Google review platform use | 71% | Consumers using Google for local reviews/recommendations. [7] |
| AI recommendation use | 45% | Use of ChatGPT and other AI tools for local recommendations. [7] |
| Apple Maps review/source use | 27% | Apple Maps usage in the survey. [7] |
Review trust benchmarks
| Benchmark | Value | How to use it |
|---|---|---|
| Minimum review threshold | 47% | Consumers who will not use a business with fewer than 20 reviews. [7] |
| Review recency threshold | 74% | Consumers seeking reviews from the last three months. [7] |
| 4.5-star threshold | 31% | Consumers only using businesses with 4.5+ stars. [7] |
| Positive review importance | 46% | Consumers naming positive review detail as important. [7] |
| Last-month review importance | 44% | Consumers caring that reviews were posted in the last month. [7] |
| High-star importance | 42% | Consumers naming high star rating as important. [7] |
| Owner response importance | 37% | Consumers caring that the owner has responded. [7] |
| Four-star threshold | 68% | Consumers only using businesses with four or more stars. [7] |
| Five-star-only threshold | 10% | Consumers requiring a five-star rating. [7] |
| Plumber employment | 504,500 jobs | U.S. plumbers, pipefitters, and steamfitters jobs in 2024. [8] |
| Median plumber pay | $62,970/year | Median annual wage in May 2024. [8] |
| Median hourly pay | $30.27/hour | Median hourly wage. [8] |
| Job outlook | 4% | Projected 2024-2034 growth, as fast as average. [8] |
| Contractor employment share | 66% | Share working for plumbing, heating, and air-conditioning contractors. [8] |
Plumbing labor and market context
| Benchmark | Value | How to use it |
|---|---|---|
| Lowest 10% earnings | Below $40,670 | Lower-end annual wage benchmark. [8] |
| Contractor median wage | $62,670 | Median wage in plumbing/HVAC contractor industry. [8] |
| Search campaigns analyzed | 16,000+ | Campaign sample behind 2025 Google Ads benchmarks. [9] |
| Overall Google Ads CPL | $70.11 | Average cost per lead across Google Ads. [9] |
| Overall Google Ads CTR | 6.66% | Average search ad click-through rate. [9] |
| Overall Google Ads CVR | 7.52% | Average conversion rate. [9] |
| CPL increase industries | 13 of 23 | Industries where cost per lead increased. [9] |
Broader paid media context
| Benchmark | Value | How to use it |
|---|---|---|
| Average CPL increase | 5.13% | Average cost per lead increase. [9] |
| CPC increase industries | 87% | Industries where cost per click increased. [9] |
| CVR increase industries | 65% | Industries where conversion rate improved. [9] |
| CTR change | 3.74% increase | Overall click-through-rate change. [9] |
| SMBs satisfied with search ads | 76% | Small businesses satisfied with search advertising tactics. [9] |
| Home services search-ad sample | 3,200+ campaigns | Home services campaign sample. [10] |
| Plumber near me searches | Almost 180,000/month | U.S. monthly searches cited by LocaliQ. [10] |
| Handyman searches | 78,000/month | Comparison monthly search volume cited by LocaliQ. [10] |
| Home services CTR YoY | 13.95% increase | Average home-services CTR increase. [10] |
| Home services CPC inflation | 75% | Home services businesses seeing CPC increase. [10] |
| Home services CVR softness | 10 of 16 subcategories | Subcategories where conversion rate decreased. [10] |
| Home services CVR YoY | 14.96% decrease | Average home-services conversion-rate decline. [10] |
| Home services CPL inflation | 69% | Home services businesses seeing CPL increase. [10] |
| Home services CPL YoY | 10.51% increase | Average home-services CPL increase. [10] |
| Home services search CTR | 6.37% | Average 2025 home-services search ad CTR. [10] |
6. Master Table: 100+ Plumbing Lead Generation Benchmarks
The table below consolidates every benchmark used in this article. Copy it into your marketing scorecard, then add your own last-30-day and last-90-day numbers next to each relevant row.
| # | Category | Metric | Value | Source |
|---|---|---|---|---|
| 1 | Paid search | Dataset size | $14.6M | SearchLight Plumbing Google Ads 2026 [1] |
| 2 | Paid search | Contractor sample | 524 contractors | SearchLight Plumbing Google Ads 2026 [1] |
| 3 | Paid search | Campaign sample | 2,554 campaigns | SearchLight Plumbing Google Ads 2026 [1] |
| 4 | Paid search | Non-branded search CPL | $183 | SearchLight Plumbing Google Ads 2026 [1] |
| 5 | Paid search | Median cost per paying customer | $333 | SearchLight Plumbing Google Ads 2026 [1] |
| 6 | Paid search | PMax CPL | $82 | SearchLight Plumbing Google Ads 2026 [1] |
| 7 | Paid search | PMax discount vs non-brand | 55% lower | SearchLight Plumbing Google Ads 2026 [1] |
| 8 | Paid search | Median PMax spend | $1,856/month | SearchLight Plumbing Google Ads 2026 [1] |
| 9 | Paid search | PMax ROAS | 5.54x | SearchLight Plumbing Google Ads 2026 [1] |
| 10 | Paid search | Non-branded ROAS | 2.58x | SearchLight Plumbing Google Ads 2026 [1] |
| 11 | Paid search | Typical total Google Ads spend | $14,206/month | SearchLight Plumbing Google Ads 2026 [1] |
| 12 | Paid search | Plumbing budget allocation | 40% | SearchLight Plumbing Google Ads 2026 [1] |
| 13 | Paid search | Spend mix: plumbing | 32% | SearchLight Plumbing Google Ads 2026 [1] |
| 14 | Paid search | Spend mix: HVAC | 30% | SearchLight Plumbing Google Ads 2026 [1] |
| 15 | Paid search | Spend mix: electrical | 6% | SearchLight Plumbing Google Ads 2026 [1] |
| 16 | Paid search | Spend mix: other/branded/general | 32% | SearchLight Plumbing Google Ads 2026 [1] |
| 17 | Paid search | Top-quartile non-brand CPL | Below $107 | SearchLight Plumbing Google Ads 2026 [1] |
| 18 | Paid search | Bottom-quartile non-brand CPL | Above $253 | SearchLight Plumbing Google Ads 2026 [1] |
| 19 | Paid search | 10th percentile non-brand CPL | $77 | SearchLight Plumbing Google Ads 2026 [1] |
| 20 | Paid search | 90th percentile non-brand CPL | $396 | SearchLight Plumbing Google Ads 2026 [1] |
| 21 | Paid search | CPL spread | 5x | SearchLight Plumbing Google Ads 2026 [1] |
| 22 | Local Services Ads | Dataset spend | $6.72M | SearchLight LSA 2026 [2] |
| 23 | Local Services Ads | Contractor sample | 888 contractors | SearchLight LSA 2026 [2] |
| 24 | Local Services Ads | Lead sample | 126,650 leads | SearchLight LSA 2026 [2] |
| 25 | Local Services Ads | Home services LSA CPL | $53 | SearchLight LSA 2026 [2] |
| 26 | Local Services Ads | LSA book rate | 43.9% | SearchLight LSA 2026 [2] |
| 27 | Local Services Ads | LSA cost per paying customer | $233 | SearchLight LSA 2026 [2] |
| 28 | Local Services Ads | LSA average ticket | $1,826 | SearchLight LSA 2026 [2] |
| 29 | Local Services Ads | LSA closed ROAS | 7.84x | SearchLight LSA 2026 [2] |
| 30 | Local Services Ads | Electrical LSA CPL | $39 | SearchLight LSA 2026 [2] |
| 31 | Local Services Ads | Electrical LSA ROAS | 8.52x | SearchLight LSA 2026 [2] |
| 32 | Local Services Ads | Electrical average ticket | $1,434 | SearchLight LSA 2026 [2] |
| 33 | Local Services Ads | Electrical book rate | 43.4% | SearchLight LSA 2026 [2] |
| 34 | Local Services Ads | HVAC LSA CPL | $51 | SearchLight LSA 2026 [2] |
| 35 | Local Services Ads | HVAC LSA ROAS | 9.55x | SearchLight LSA 2026 [2] |
| 36 | Local Services Ads | HVAC average ticket | $2,110 | SearchLight LSA 2026 [2] |
| 37 | Local Services Ads | General/all-trades spend | $2.51M | SearchLight LSA 2026 [2] |
| 38 | Local Services Ads | General/all-trades accounts | 464 accounts | SearchLight LSA 2026 [2] |
| 39 | Local Services Ads | General/all-trades share | 37.3% | SearchLight LSA 2026 [2] |
| 40 | Local Services Ads | General/all-trades CPL | $54 | SearchLight LSA 2026 [2] |
| 41 | Local Services Ads | Drain/sewer book rate | 39.5% | SearchLight LSA 2026 [2] |
| 42 | Local Services Ads | Drain/sewer CPL | $59 | SearchLight LSA 2026 [2] |
| 43 | Local Services Ads | Drain/sewer ROAS | 5.50x | SearchLight LSA 2026 [2] |
| 44 | Local Services Ads | Contractor A book rate | 48% | SearchLight LSA 2026 [2] |
| 45 | Local Services Ads | Contractor A average ticket | $2,800 | SearchLight LSA 2026 [2] |
| 46 | Local Services Ads | Contractor A match rate | 45% | SearchLight LSA 2026 [2] |
| 47 | Local Services Ads | Contractor A cost per customer | $180 | SearchLight LSA 2026 [2] |
| 48 | Local Services Ads | Contractor A ROAS | 15.6x | SearchLight LSA 2026 [2] |
| 49 | Local Services Ads | Contractor B book rate | 30% | SearchLight LSA 2026 [2] |
| 50 | Local Services Ads | Contractor B average ticket | $1,200 | SearchLight LSA 2026 [2] |
| 51 | Local Services Ads | Contractor B match rate | 25% | SearchLight LSA 2026 [2] |
| 52 | Local Services Ads | Contractor B cost per customer | $440 | SearchLight LSA 2026 [2] |
| 53 | Local Services Ads | Contractor B ROAS | 2.7x | SearchLight LSA 2026 [2] |
| 54 | Local Services Ads | LSA vs blended Google Ads | 49% less expensive | SearchLight LSA 2026 [2] |
| 55 | Local Services Ads | LSA vs non-brand Google Ads | 64% less expensive | SearchLight LSA 2026 [2] |
| 56 | Local Services Ads | Non-brand Google Ads book rate | 37.6% | SearchLight LSA 2026 [2] |
| 57 | Calls and booking | Call dataset | 60M+ calls | Invoca / Supply House Times 2025 [3] |
| 58 | Calls and booking | Callers reaching a person | 61% | Invoca / Supply House Times 2025 [3] |
| 59 | Calls and booking | Answer-rate range | 54%-69% | Invoca / Supply House Times 2025 [3] |
| 60 | Calls and booking | Qualified digital call leads | 35% | Invoca / Supply House Times 2025 [3] |
| 61 | Calls and booking | High-end lead rate | 54% | Invoca / Supply House Times 2025 [3] |
| 62 | Calls and booking | Phone leads converting during call | 37% | Invoca / Supply House Times 2025 [3] |
| 63 | Calls and booking | Home services conversion rate | 46% | Invoca / Supply House Times 2025 [3] |
| 64 | Calls and booking | Excellent call rating | 28% | Invoca / Supply House Times 2025 [3] |
| 65 | Calls and booking | Agents asking for booking/purchase | 35% | Invoca / Supply House Times 2025 [3] |
| 66 | Calls and booking | Automotive conversion | 42% | Invoca / Supply House Times 2025 [3] |
| 67 | Calls and booking | Business services conversion | 22% | Invoca / Supply House Times 2025 [3] |
| 68 | Calls and booking | Consumer services conversion | 36% | Invoca / Supply House Times 2025 [3] |
| 69 | Calls and booking | Financial services conversion | 29% | Invoca / Supply House Times 2025 [3] |
| 70 | Calls and booking | Healthcare conversion | 40% | Invoca / Supply House Times 2025 [3] |
| 71 | Calls and booking | Senior care conversion | 41% | Invoca / Supply House Times 2025 [3] |
| 72 | Calls and booking | Typical trade booking rate | 42% | ServiceTitan Call Booking Rates [4] |
| 73 | Calls and booking | Booking gain revenue impact | $100,000 | ServiceTitan Call Booking Rates [4] |
| 74 | Calls and booking | Booking gain required | One call in 20 | ServiceTitan Call Booking Rates [4] |
| 75 | Calls and booking | Best-practice booking target | 90% | ServiceTitan Call Booking Rates [4] |
| 76 | Calls and booking | Trade business sample | 3,000+ businesses | ServiceTitan Call Booking Rates [4] |
| 77 | Calls and booking | Large-shop booking rate | 59% | ServiceTitan Call Booking Rates [4] |
| 78 | Calls and booking | Small-shop booking rate | 24% | ServiceTitan Call Booking Rates [4] |
| 79 | Calls and booking | Large-shop peak vs after-hours | 61% to 21% | ServiceTitan Call Booking Rates [4] |
| 80 | Calls and booking | Small-shop peak vs after-hours | 26% to 9% | ServiceTitan Call Booking Rates [4] |
| 81 | Calls and booking | Year-over-year booking lift | 2%-5% | ServiceTitan Call Booking Rates [4] |
| 82 | Calls and booking | Plumbing June booking rate | 43% | ServiceTitan Call Booking Rates [4] |
| 83 | Calls and booking | Electrical June booking rate | 41% | ServiceTitan Call Booking Rates [4] |
| 84 | Calls and booking | HVAC June booking rate | 38% | ServiceTitan Call Booking Rates [4] |
| 85 | Calls and booking | Garage/water treatment booking rate | 31% | ServiceTitan Call Booking Rates [4] |
| 86 | Calls and booking | Top-company booking range | 77% | ServiceTitan Call Booking Rates [4] |
| 87 | Demand, trust, and channel context | Consumers expecting online booking | 70% | ServiceTitan Online Booking [5] |
| 88 | Demand, trust, and channel context | New-contractor shoppers favor online booking | 94% | ServiceTitan Online Booking [5] |
| 89 | Demand, trust, and channel context | Online appointments booked | 500,000+ | ServiceTitan Online Booking [5] |
| 90 | Demand, trust, and channel context | Revenue from online appointments | $30M+ | ServiceTitan Online Booking [5] |
| 91 | Demand, trust, and channel context | Dispatch scan cadence | Every 10 minutes | ServiceTitan Online Booking [5] |
| 92 | Demand, trust, and channel context | Business-owner survey | 1,000+ owners | Jobber 2026 Home Service Trends [6] |
| 93 | Demand, trust, and channel context | Expect revenue growth | 75% | Jobber 2026 Home Service Trends [6] |
| 94 | Demand, trust, and channel context | Expect significant revenue jump | 1 in 5 | Jobber 2026 Home Service Trends [6] |
| 95 | Demand, trust, and channel context | High-confidence businesses raised prices | 91% | Jobber 2026 Home Service Trends [6] |
| 96 | Demand, trust, and channel context | High-confidence pricing confidence | 93% | Jobber 2026 Home Service Trends [6] |
| 97 | Demand, trust, and channel context | High-confidence quote close | Nearly 90% | Jobber 2026 Home Service Trends [6] |
| 98 | Demand, trust, and channel context | Same-day response expectation | Over 70% | Jobber 2026 Home Service Trends [6] |
| 99 | Demand, trust, and channel context | One-hour response expectation | More than half | Jobber 2026 Home Service Trends [6] |
| 100 | Demand, trust, and channel context | Workmanship satisfaction driver | 69% | Jobber 2026 Home Service Trends [6] |
| 101 | Demand, trust, and channel context | Clear communication driver | 32% | Jobber 2026 Home Service Trends [6] |
| 102 | Demand, trust, and channel context | Professional behavior driver | 31% | Jobber 2026 Home Service Trends [6] |
| 103 | Demand, trust, and channel context | Referral lead volume | 59% | Jobber 2026 Home Service Trends [6] |
| 104 | Demand, trust, and channel context | Google lead channel | 20% | Jobber 2026 Home Service Trends [6] |
| 105 | Demand, trust, and channel context | Facebook lead channel | 32% | Jobber 2026 Home Service Trends [6] |
| 106 | Demand, trust, and channel context | LSA lead channel | 19% | Jobber 2026 Home Service Trends [6] |
| 107 | Demand, trust, and channel context | High-confidence AI adoption | 88% | Jobber 2026 Home Service Trends [6] |
| 108 | Demand, trust, and channel context | Low-confidence AI adoption | 27% | Jobber 2026 Home Service Trends [6] |
| 109 | Demand, trust, and channel context | Under-30 AI adoption | 64% | Jobber 2026 Home Service Trends [6] |
| 110 | Demand, trust, and channel context | Demand increased | Nearly 60% | Jobber 2026 Home Service Trends [6] |
| 111 | Demand, trust, and channel context | Significant demand jump | 16% | Jobber 2026 Home Service Trends [6] |
| 112 | Demand, trust, and channel context | Under-30 demand increase | 75% | Jobber 2026 Home Service Trends [6] |
| 113 | Demand, trust, and channel context | Under-30 significant demand jump | 1 in 4 | Jobber 2026 Home Service Trends [6] |
| 114 | Demand, trust, and channel context | High-revenue significant demand jump | 23% | Jobber 2026 Home Service Trends [6] |
| 115 | Demand, trust, and channel context | Fully booked or close | 80% | Jobber 2026 Home Service Trends [6] |
| 116 | Demand, trust, and channel context | Trouble filling schedules | 3% | Jobber 2026 Home Service Trends [6] |
| 117 | Demand, trust, and channel context | Seasonality not scheduling | 1% | Jobber 2026 Home Service Trends [6] |
| 118 | Demand, trust, and channel context | Growing/established booked | 90%+ | Jobber 2026 Home Service Trends [6] |
| 119 | Demand, trust, and channel context | Newer businesses with gaps | 40%+ | Jobber 2026 Home Service Trends [6] |
| 120 | Demand, trust, and channel context | Consumers reading reviews | 97% | BrightLocal Local Consumer Review Survey [7] |
| 121 | Demand, trust, and channel context | Always read reviews | 41% | BrightLocal Local Consumer Review Survey [7] |
| 122 | Demand, trust, and channel context | Google review platform use | 71% | BrightLocal Local Consumer Review Survey [7] |
| 123 | Demand, trust, and channel context | AI recommendation use | 45% | BrightLocal Local Consumer Review Survey [7] |
| 124 | Demand, trust, and channel context | Apple Maps review/source use | 27% | BrightLocal Local Consumer Review Survey [7] |
| 125 | Demand, trust, and channel context | Minimum review threshold | 47% | BrightLocal Local Consumer Review Survey [7] |
| 126 | Demand, trust, and channel context | Review recency threshold | 74% | BrightLocal Local Consumer Review Survey [7] |
| 127 | Demand, trust, and channel context | 4.5-star threshold | 31% | BrightLocal Local Consumer Review Survey [7] |
| 128 | Demand, trust, and channel context | Positive review importance | 46% | BrightLocal Local Consumer Review Survey [7] |
| 129 | Demand, trust, and channel context | Last-month review importance | 44% | BrightLocal Local Consumer Review Survey [7] |
| 130 | Demand, trust, and channel context | High-star importance | 42% | BrightLocal Local Consumer Review Survey [7] |
| 131 | Demand, trust, and channel context | Owner response importance | 37% | BrightLocal Local Consumer Review Survey [7] |
| 132 | Demand, trust, and channel context | Four-star threshold | 68% | BrightLocal Local Consumer Review Survey [7] |
| 133 | Demand, trust, and channel context | Five-star-only threshold | 10% | BrightLocal Local Consumer Review Survey [7] |
| 134 | Demand, trust, and channel context | Plumber employment | 504,500 jobs | BLS Occupational Outlook Handbook [8] |
| 135 | Demand, trust, and channel context | Median plumber pay | $62,970/year | BLS Occupational Outlook Handbook [8] |
| 136 | Demand, trust, and channel context | Median hourly pay | $30.27/hour | BLS Occupational Outlook Handbook [8] |
| 137 | Demand, trust, and channel context | Job outlook | 4% | BLS Occupational Outlook Handbook [8] |
| 138 | Demand, trust, and channel context | Contractor employment share | 66% | BLS Occupational Outlook Handbook [8] |
| 139 | Demand, trust, and channel context | Lowest 10% earnings | Below $40,670 | BLS Occupational Outlook Handbook [8] |
| 140 | Demand, trust, and channel context | Contractor median wage | $62,670 | BLS Occupational Outlook Handbook [8] |
| 141 | Demand, trust, and channel context | Search campaigns analyzed | 16,000+ | WordStream/LocaliQ Google Ads 2025 [9] |
| 142 | Demand, trust, and channel context | Overall Google Ads CPL | $70.11 | WordStream/LocaliQ Google Ads 2025 [9] |
| 143 | Demand, trust, and channel context | Overall Google Ads CTR | 6.66% | WordStream/LocaliQ Google Ads 2025 [9] |
| 144 | Demand, trust, and channel context | Overall Google Ads CVR | 7.52% | WordStream/LocaliQ Google Ads 2025 [9] |
| 145 | Demand, trust, and channel context | CPL increase industries | 13 of 23 | WordStream/LocaliQ Google Ads 2025 [9] |
| 146 | Demand, trust, and channel context | Average CPL increase | 5.13% | WordStream/LocaliQ Google Ads 2025 [9] |
| 147 | Demand, trust, and channel context | CPC increase industries | 87% | WordStream/LocaliQ Google Ads 2025 [9] |
| 148 | Demand, trust, and channel context | CVR increase industries | 65% | WordStream/LocaliQ Google Ads 2025 [9] |
| 149 | Demand, trust, and channel context | CTR change | 3.74% increase | WordStream/LocaliQ Google Ads 2025 [9] |
| 150 | Demand, trust, and channel context | SMBs satisfied with search ads | 76% | WordStream/LocaliQ Google Ads 2025 [9] |
| 151 | Demand, trust, and channel context | Home services search-ad sample | 3,200+ campaigns | LocaliQ Home Services Search Ads 2025 [10] |
| 152 | Demand, trust, and channel context | Plumber near me searches | Almost 180,000/month | LocaliQ Home Services Search Ads 2025 [10] |
| 153 | Demand, trust, and channel context | Handyman searches | 78,000/month | LocaliQ Home Services Search Ads 2025 [10] |
| 154 | Demand, trust, and channel context | Home services CTR YoY | 13.95% increase | LocaliQ Home Services Search Ads 2025 [10] |
| 155 | Demand, trust, and channel context | Home services CPC inflation | 75% | LocaliQ Home Services Search Ads 2025 [10] |
| 156 | Demand, trust, and channel context | Home services CVR softness | 10 of 16 subcategories | LocaliQ Home Services Search Ads 2025 [10] |
| 157 | Demand, trust, and channel context | Home services CVR YoY | 14.96% decrease | LocaliQ Home Services Search Ads 2025 [10] |
| 158 | Demand, trust, and channel context | Home services CPL inflation | 69% | LocaliQ Home Services Search Ads 2025 [10] |
| 159 | Demand, trust, and channel context | Home services CPL YoY | 10.51% increase | LocaliQ Home Services Search Ads 2025 [10] |
| 160 | Demand, trust, and channel context | Home services search CTR | 6.37% | LocaliQ Home Services Search Ads 2025 [10] |
Methodology and Source Notes
This article aggregates public 2025-2026 benchmark pages, trade-software reports, advertising benchmark studies, consumer review research, and government labor data. Plumbing-specific benchmarks are prioritized where available. When a source reports home services or multi-trade data instead of plumbing-only data, the article labels it as home services, trade business, or general context rather than presenting it as plumbing-only.
- SearchLight Plumbing Google Ads 2026
- SearchLight LSA 2026
- Invoca / Supply House Times 2025
- ServiceTitan Call Booking Rates
- ServiceTitan Online Booking
- Jobber 2026 Home Service Trends
- BrightLocal Local Consumer Review Survey
- BLS Occupational Outlook Handbook
- WordStream/LocaliQ Google Ads 2025
- LocaliQ Home Services Search Ads 2025
Frequently Asked Questions
Use channel-specific benchmarks rather than one blended number. In the sources used here, plumbing non-branded Google Ads cost per lead is about $183 in one 2026 dataset, PMax is about $82, home services LSA is about $53, and ServiceTitan reports a 43% plumbing call-booking benchmark. Your own answer rate, booking rate, average ticket, and close rate determine whether those leads are profitable.
Fix the handoff from lead to booked job first. If calls are missed, CSRs do not ask for the appointment, or forms sit unanswered, adding more ad spend only buys more leakage. After the call path is measured, use local SEO, Google Business Profile, paid search, LSAs, referrals, and review generation together.
Track a small operating dashboard weekly: impressions, calls, forms, booked jobs, answer rate, qualified-call rate, booking rate, cost per booked job, cost per sold job, average ticket, review count, review recency, and source-level revenue. The full benchmark table below gives context, but the working scorecard should fit on one page.
Yes. Phone leads are urgent, but ServiceTitan reports that 70% of consumers expect online booking and that consumers looking for a new contractor are more likely to choose a contractor that offers online booking. Forms and booking widgets should route quickly to dispatch or CSR follow-up, not sit in an inbox.
In the SearchLight 2026 datasets cited below, home services LSA averaged $53 per lead and was reported as 49% less expensive than blended Google Ads and 64% less expensive than non-branded Google Ads. That does not automatically make LSA better: book rate, match rate, disputed leads, average ticket, and capacity decide profitability.
Want to Find the Leak in Your Plumbing Lead Funnel?
We can review your local rankings, call paths, review profile, and landing-page conversion points so you know which fix should happen before you spend more on leads.
Run My Free SEO Leak Check