
The U.S. plumbing industry is now valued at $169.8 billion [1], yet 87% of plumbing contractors are completely invisible when homeowners ask AI assistants for a recommendation [5]. Meanwhile, 46% of all Google searches have local intent [2], and 97% of consumers read reviews before choosing a local business [4]. Whether you are a plumbing company owner trying to get more calls or an agency building a strategy, these are the numbers you need.
We compiled 75+ verified statistics from sources including BrightLocal, Whitespark, IBISWorld, the Bureau of Labor Statistics, and the 5W AI Visibility Index. Every data point links to its original source. Use the table of contents to jump to the section most relevant to your business.
- The U.S. plumbing sector is a $169.8 billion industry with 132,000+ businesses [1]
- 46% of all Google searches have local intent - nearly half of all search demand [2]
- Google Business Profile signals account for 32% of local pack ranking weight [3]
- 97% of consumers read online reviews before choosing a local business [4]
- 31% of consumers will only use a business with 4.5+ stars, up from 17% the prior year [4]
- 87% of independent plumbing contractors have zero AI citation share in their metro [5]
- 45% of consumers now use ChatGPT or AI tools for local business recommendations [4]
- 64% of all local searches happen on mobile devices [6]
- 78% of mobile local searchers visit or call within 48 hours [6]
- Plumbing leads convert at 12-16%, the highest rate in home services [7]
- 55% of plumbing leads come from Google Maps listings [8]
- Only 26% of plumbing companies actively invest in SEO [8]
- SEO cost per lead averages $10-40 vs $30-120 for PPC long-term [8]
- 12.7% of plumber reviews are now likely AI-generated, up from 2.6% in 2020 [9]
- 64.82% of Google searches now end without a click (zero-click searches) [10]
1. Plumbing Industry Market Size and Growth
The plumbing industry is massive and growing. Understanding its scale helps contextualize why SEO competition for plumbing keywords is intensifying year over year.
- $169.8 billion: Total U.S. plumbing industry revenue in 2025. [1]
- 132,000+: Total plumbing businesses operating in the U.S. [1]
- 550,000+: Employed plumbers, pipefitters, and steamfitters in the U.S. [11]
- 2%: Average annual industry growth rate. [1]
- $786.2 billion: Projected total digital marketing and advertising industry value by end of 2026. [12]
- $77.6 billion: Estimated value of the global SEO industry. [12]
- Only 26%: Plumbing companies that actively invest in SEO. [8]
- 70%: Plumbers who are unhappy with their current SEO provider. [12]
The takeaway: the plumbing market is enormous, but the vast majority of companies are not competing for online visibility. For companies that invest now, the opportunity gap is significant. If you are wondering how much plumbing companies should actually spend on SEO, the data strongly suggests that under-investment is the bigger risk.
2. Local Search Behavior Statistics
Understanding how homeowners search for plumbing services is the foundation of any effective SEO strategy. These statistics reveal the search patterns that drive plumbing leads.
- 46%: Percentage of all Google searches that have local intent. [2]
- 92%: Google's search engine market share globally. [12]
- 99,000: Google search queries processed per second. [12]
- 3.5: Average number of Google searches performed per user per day. [12]
- 28%: Local searches that result in a purchase or transaction. [12]
- 78%: Mobile local searchers who visit or call a business within 48 hours. [6]
- 50%: Searches that contain four or more words (long-tail). [12]
- 64%: Percentage of all website traffic that Google is responsible for. [12]
- 73%: Consumers who lose trust if online business information is inconsistent. [13]
For plumbing companies, these numbers make one thing clear: Google is where your customers are, and nearly half of them are looking for someone local. If your business is not optimized for local intent queries like "plumber near me" or "emergency plumber [city]," you are invisible to nearly half of all search demand. Our plumbing keyword strategy guide breaks down exactly which search terms to target.
3. Google Maps and Local Pack Statistics
The Google Local Pack (the map with three business listings that appears at the top of local search results) is where the majority of plumbing clicks happen. Dominating this space is the high-impact activity for any plumbing company's online presence.
- 42%: Local queries that result in map pack clicks. [12]
- 44%: Click-through rate for Local 3-Pack listings. [14]
- 70%: Mobile searches for local businesses that result in map pack clicks. [12]
- 55%: Plumbing leads that come from Google Maps listings. [8]
- 89%: Increase in customer actions for businesses that actively update their profiles. [13]
- 42%: More direction requests for listings with high-quality photos. [13]
- 30%: Increase in engagement from weekly Google Business Profile posts. [13]
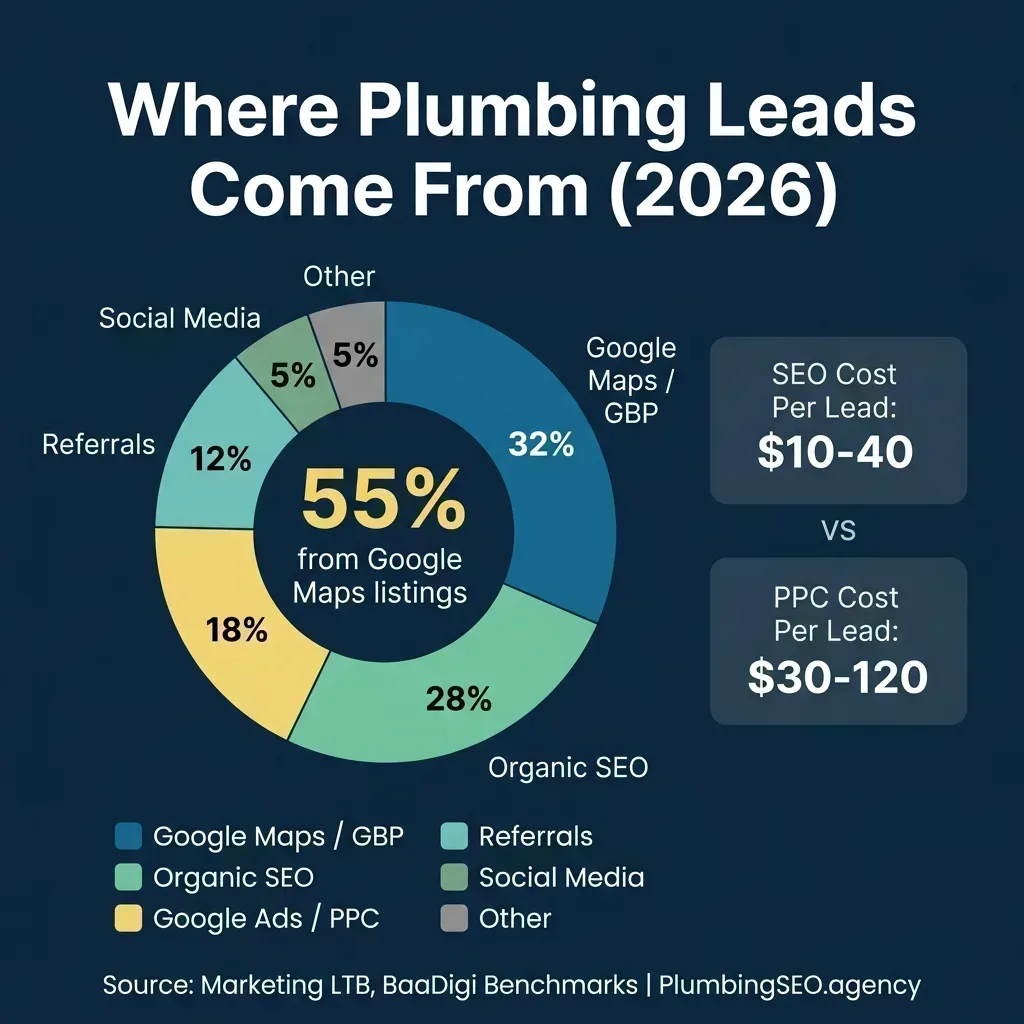
The typical lead source distribution for plumbing companies. Over half of all leads originate from Google Maps listings.
The data is clear: more than half of your plumbing leads come through Google Maps. If you are not in the Local 3-Pack for your primary service keywords, you are missing the majority of local clicks. Our Google Maps SEO guide for plumbers walks through the exact process to get there.
4. Local Search Ranking Factor Statistics
What actually determines whether your plumbing company shows up in the Local Pack? Whitespark's annual Local Search Ranking Factors survey [3] provides the most comprehensive answer, based on input from dozens of top local SEO practitioners.
- 32%: Weight of Google Business Profile signals in local pack rankings (categories, hours, photos, posts, proximity). [3]
- 20%: Weight of review signals (velocity, volume, diversity, response rate). [3]
- 15%: Weight of on-page signals (NAP, keyword in title, domain authority). [3]
- 6: Average number of Google algorithm changes per day. [12]
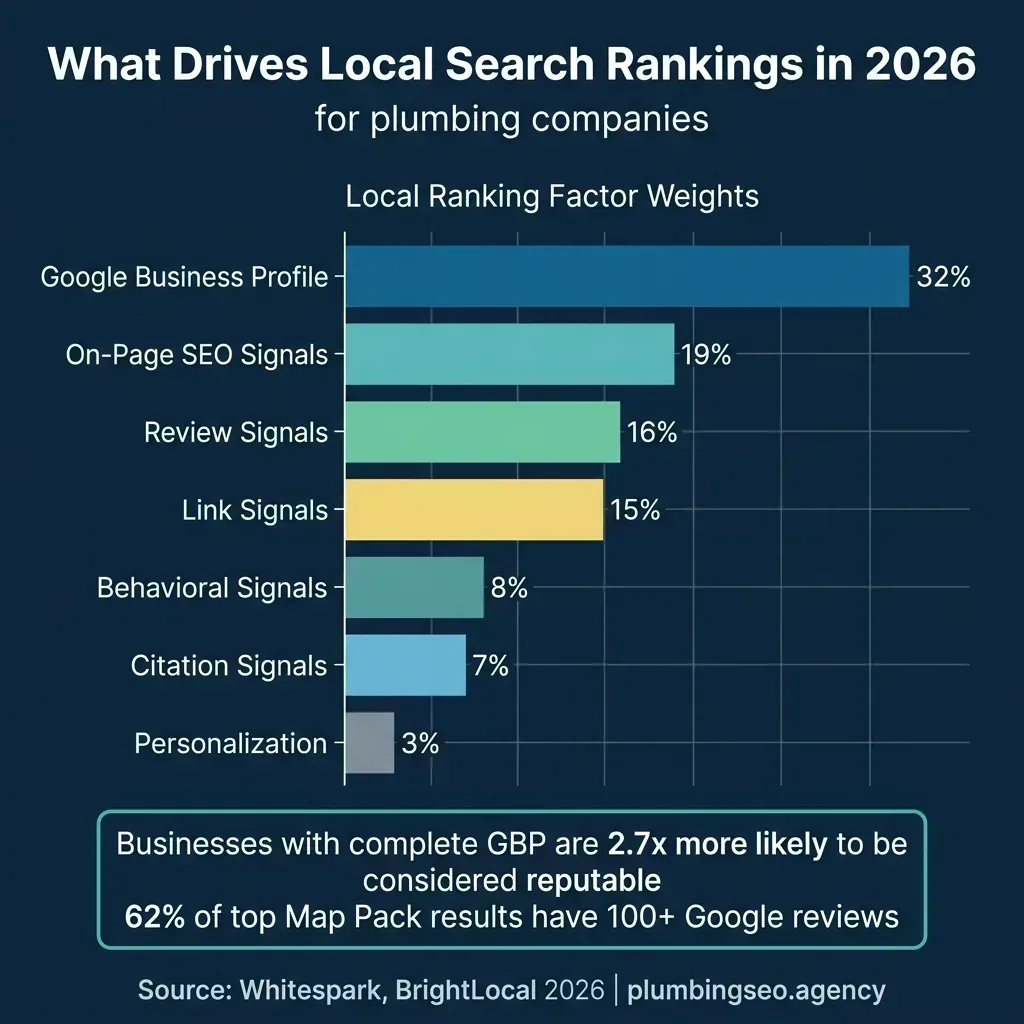
GBP and review signals together account for over half of what determines your Local Pack position. Source: Whitespark 2025 Local Search Ranking Factors.
GBP signals and reviews alone account for over 50% of local ranking weight. That means your Google Business Profile optimization and review strategy are more important than any other SEO activity for local visibility. If you are investing in link building but ignoring your GBP, your priorities are backwards.
5. Reviews and Reputation Statistics
Reviews are the second most important ranking factor for the Local Pack, but their impact goes far beyond rankings. They directly influence whether a homeowner calls your company or your competitor.
- 97%: Consumers who read online reviews for local businesses. [4]
- 90%: Consumers who read reviews before visiting a business. [13]
- 41%: Consumers who always read reviews before choosing a business (up from 29% last year). [15]
- 31%: Consumers who will only use a business with 4.5+ stars (up from 17% last year). [4]
- 74%: Consumers who only care about reviews from the last 90 days. [16]
- 71%: Consumers who use Google to read local business reviews. [2]
- 62%: Consumers who read more reviews now than they did 5 years ago. [17]
- 97%: Consumers who read reviews also read business responses to reviews. [17]
- 92%: Google searches for "plumbing + city" that yield Yelp results in the top 5. [12]
- 3x: More leads generated by plumbing businesses with 50+ reviews. [8]
- 80%: Higher conversion rate when businesses respond to 32%+ of their reviews. [8]
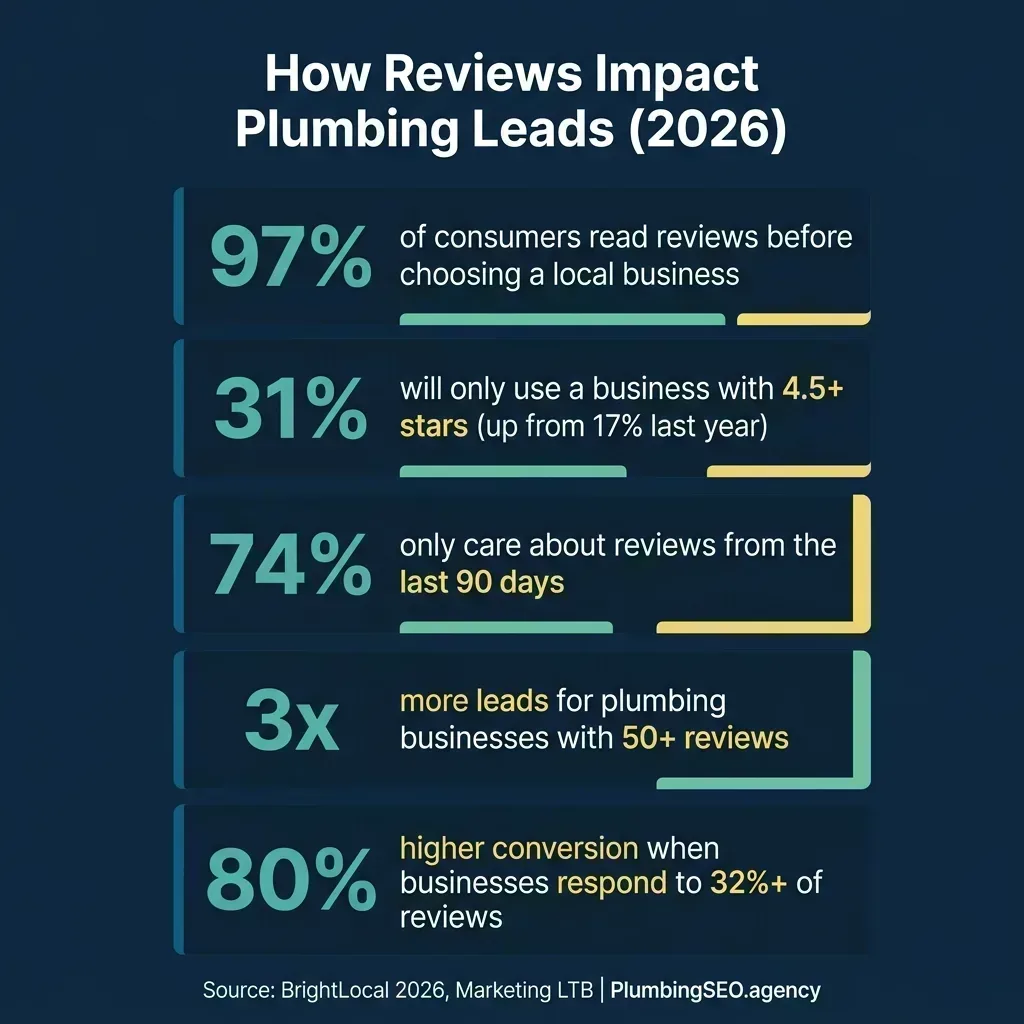
Review expectations have drastically increased in just one year. Plumbing companies below 4.5 stars are losing nearly a third of potential customers.
AI-Generated Plumber Reviews: A Growing Concern
One emerging trend worth monitoring: AI-generated reviews are growing rapidly in the plumbing industry.
- 12.7%: Plumber reviews classified as likely AI-generated in 2025 (up from 2.6% in 2020). [9]
- 8.1%: Total plumber reviews classified as likely AI across the full dataset. [9]
- 73.3%: AI-classified reviews that were 5-star ratings (used for reputation boosting). [9]
- 22.1%: AI-classified reviews that were 1-star (used for competitor sabotage). [9]
The best defense against fake reviews (both for and against your business) is to build a consistent system for generating authentic reviews from real customers. Our guide to getting more 5-star reviews covers the exact process.
6. Mobile Search and Phone Call Statistics
Plumbing is fundamentally a phone-first industry. A homeowner with a burst pipe is not filling out a form - they are calling. These statistics show why mobile optimization is non-negotiable.
- 64%: Local searches conducted on mobile devices. [6]
- 51%: Consumers who have discovered a new business via mobile search. [12]
- 87%: Smartphone users who use search engines at least once per day. [12]
- 30%: Mobile searches related to location. [12]
- 48%: Consumers who conduct mobile research via a search engine. [12]
- 78%: Mobile local searchers who visit or call within 48 hours. [6]
- 46%: Home services phone call-to-lead conversion rate. [18]
- 78%: Jobs that go to whichever plumber responds first. [8]
- $125,000: Estimated annual revenue lost per plumbing company due to missed calls. [8]
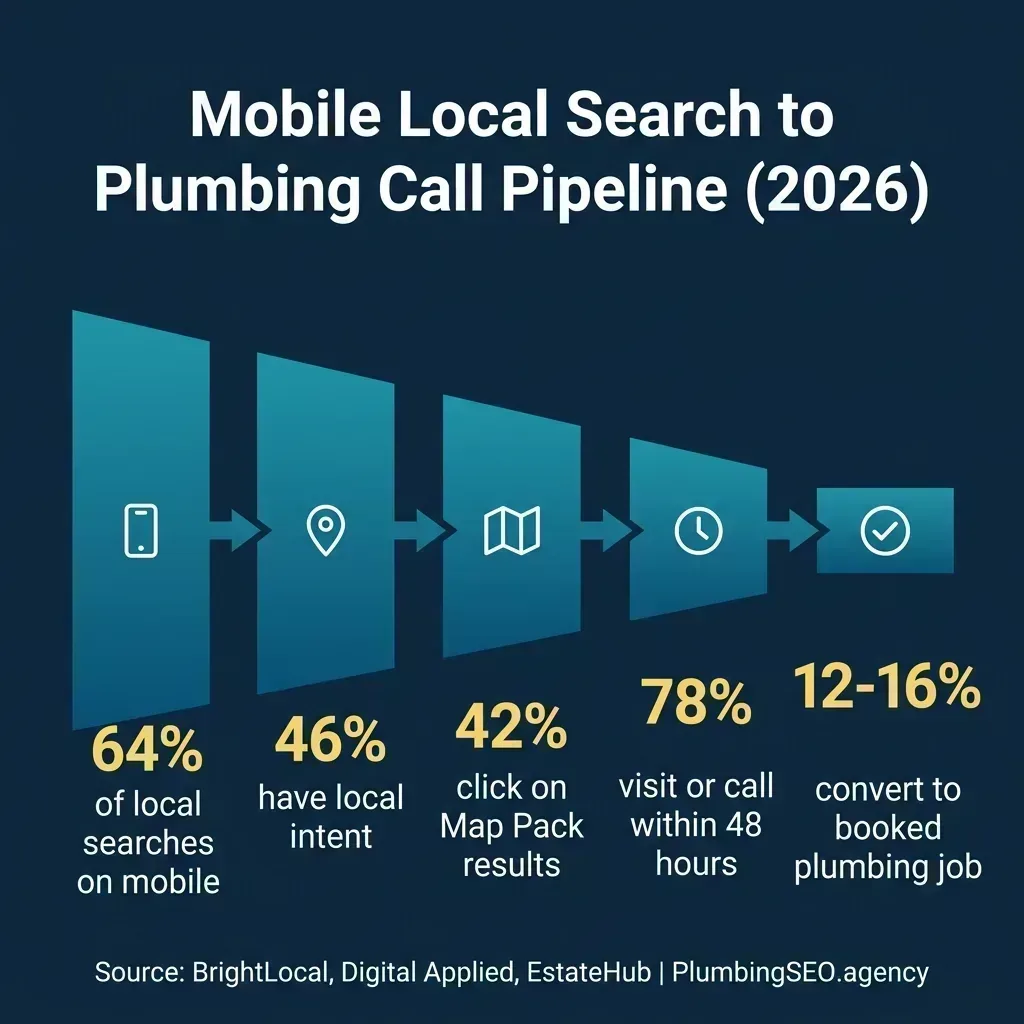
The mobile-to-call pipeline: from search to booked job. Every stage where your business is not optimized is a leak in the funnel.
The data paints a clear picture: most plumbing searches happen on mobile, and most mobile searchers call within 48 hours. If your website is not mobile-optimized with prominent click-to-call buttons, you are leaking leads at every stage of the funnel. Learn how to fix the most common issues in our guide to why plumber websites fail to generate calls. And if you want to know where those calls are actually coming from, read our call tracking guide for plumbers.
7. AI Search and Visibility Statistics
AI is reshaping how consumers discover local businesses. Google AI Overviews, ChatGPT, and Perplexity are creating a new visibility layer where most plumbing contractors are completely absent.
- 87%: Independent HVAC and plumbing contractors invisible to AI search in their metro area. [5]
- 1.2%: Local businesses recommended by AI search tools. [19]
- 30x: How much harder it is to appear in AI results vs Google local search. [20]
- 45%: Consumers who use ChatGPT or AI tools for local business recommendations. [4]
- 206%: Growth in ChatGPT referral traffic in 2025. [21]
- 900M: ChatGPT weekly active users as of Q1 2026. [22]
- 13%: Google queries that now include AI Overviews. [13]
- 15%: Estimated searches where AI Overviews appear. [12]
- 7%: Local searches where AI Overviews appear (lower than non-local). [23]
- 64.82%: Google searches that now end without a click (zero-click). [10]
- 58%: Average organic CTR reduction for position-one content when AI Overviews appear. [24]
- <30%: Small businesses currently using AI in their marketing strategy. [12]
- 3%: Search traffic currently handled by AI assistants. [13]
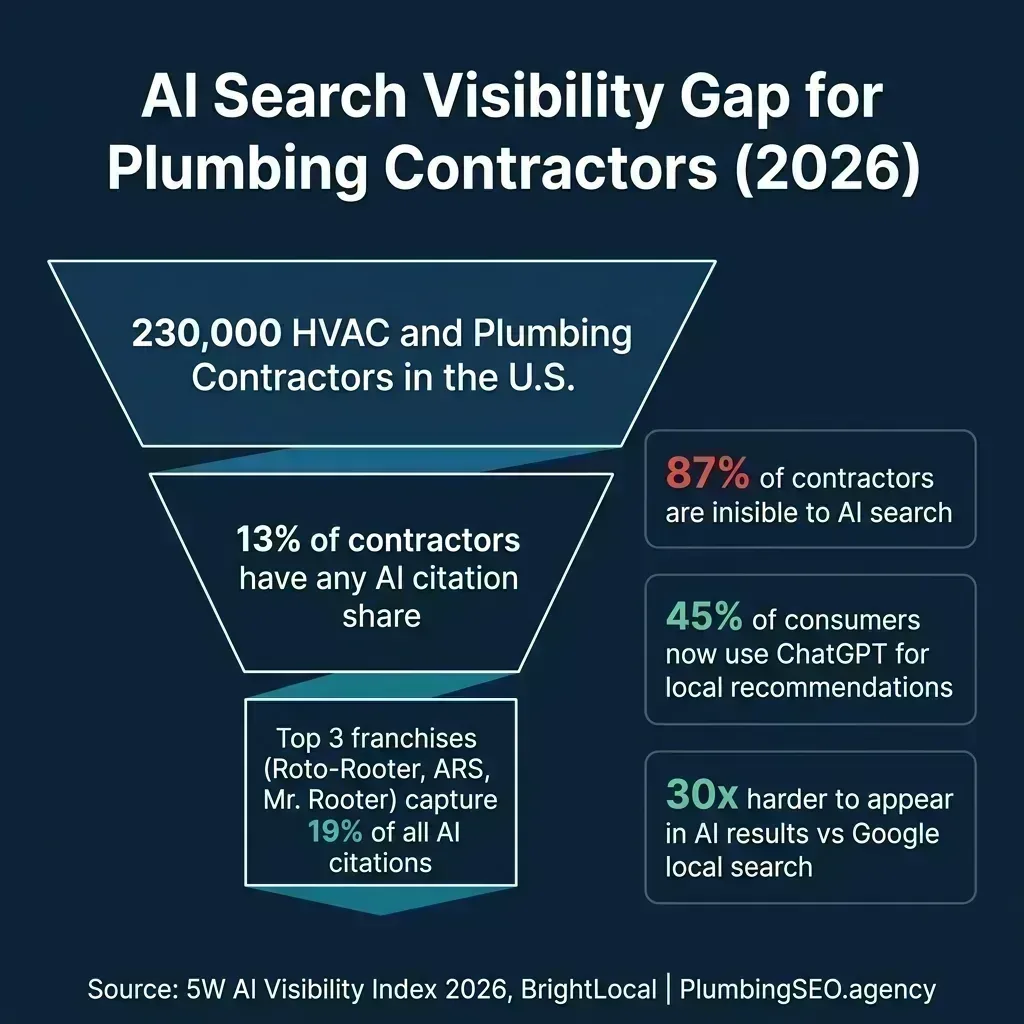
The AI visibility gap: 87% of plumbing contractors have zero AI citation share. Franchises dominate AI recommendations.
The key insight: AI visibility is dominated by structured data, strong review profiles, and authoritative citations, the same foundations that drive Google Maps rankings. If you are already investing in schema markup and NAP citations, you are building the infrastructure that AI platforms need to recommend your business.
8. Lead Sources and Conversion Rate Statistics
Where do plumbing leads actually come from, and what does it cost to acquire them? These benchmarks help plumbing companies evaluate their marketing ROI and allocate budgets effectively.
- 55%: Plumbing leads from Google Maps/GBP listings. [8]
- 12-16%: Plumbing lead conversion rate (highest in home services). [7]
- 15.61%: Plumbing Google Ads conversion rate (one of the highest in home services PPC). [25]
- 2-5%: Average website conversion rate for plumbing companies. [26]
- $18: Average cost per click for "emergency plumber" in Google Ads. [27]
- $10-40: SEO cost per lead for plumbing companies (long-term average). [8]
- $30-120: PPC cost per lead for plumbing companies. [8]
- $35-65: Google Local Service Ads cost per contact for plumbers. [28]
- 5+ minutes: Response time threshold. Companies responding within 5 minutes are 8x more likely to book the job. [8]
The math favors SEO strongly for long-term lead cost. While PPC generates leads faster, SEO delivers leads at 3-10x lower cost per acquisition over time. For a deeper analysis, read our SEO vs PPC comparison for plumbers.
9. SEO vs PPC Statistics for Plumbers
The perennial debate: should plumbing companies invest in SEO, PPC, or both? The data strongly favors a combined approach, but the economics of each channel are very different.
- SEO drives 300%: more traffic than social media. [12]
- 69.1%: Google clicks going to the top 5 organic results. [12]
- 70.5%: American Google clicks going to organic results (vs paid). [12]
- 37.7%: Higher CTR for first organic result vs first ad result. [12]
- 75%: Search users who never make it to page 2 of results. [12]
- 96.55%: Website pages that get zero traffic from Google. [12]
- 12%: Annual growth rate in local ad spend through 2028. [13]
10. Website and Technical SEO Statistics
Your website is the conversion engine behind all your SEO efforts. These statistics highlight common issues and benchmark performance.
- 94%: Users who consider user-friendly navigation their top website priority. [12]
- ~25%: Small business websites lacking H1 tags. [12]
- 96.55%: Website pages that receive zero organic traffic. [12]
- 252,000: New websites launched every day. [12]
- 2-5%: Average plumbing website conversion rate. 5%+ is considered "good." [26]
- 65%: Mobile users who prioritize the most relevant info regardless of source. [12]
If your website is not loading fast, structured properly, or converting visitors to calls, no amount of SEO investment will produce results. Our technical SEO checklist covers the 15 most common developer mistakes, and our website anatomy guide shows what every page needs to convert visitors into callers.
This resource compiles 75+ statistics from peer-reviewed research, industry surveys, government databases, and primary source publications. Data was collected between April-May 2026. Where multiple sources reported the same metric, we prioritized the most recent data and the most authoritative source. Statistics from surveys are subject to sample size limitations noted in their original publications.
Primary sources include:
- [1] Plumbing Webmasters: Plumbing Industry Statistics
- [2] BrightLocal: Local SEO Statistics
- [3] Whitespark / Advice Local: 2026 Local Search Ranking Factors
- [4] BrightLocal: Local Consumer Review Survey 2026
- [5] 5W AI Visibility Index / PM Magazine
- [6] Digital Applied: Local SEO Statistics 2026
- [7] EstateHub: 2026 Benchmarks for Lead Conversion Rates
- [8] Marketing LTB: Plumbing Marketing Statistics
- [9] Originality.ai: AI Plumber Reviews
- [10] Digital Applied: Zero-Click Search Statistics 2026
- [11] Bureau of Labor Statistics: Plumbers and Pipefitters
- [12] Plumbing Webmasters: 7 Marketing Statistics for Plumbers
- [13] Mobal / Business Wire: 10 Local SEO Statistics
- [14] PlumberSEO.net: The Google Maps Playbook
- [15] BrightLocal / CCC: Local Consumer Review Survey
- [16] BrightLocal: How to Build a Review Strategy
- [17] SearchLab / BrightLocal: Online Reviews Statistics
- [18] Invoca: Home Services Call Performance Report
- [19] National Law Review: AI Search Recommends 1.2% Local Businesses
- [20] Search Engine Land: AI Local Visibility Report 2026
- [21] Busylike / Semrush: Increase Visibility in ChatGPT
- [22] TechnologyChecker: ChatGPT Statistics
- [23] Heroic Rankings: Google AI Overview Statistics 2026
- [24] Accelerate Marketing: Surviving AI Overviews
- [25] Amra and Elma: Plumber Marketing Statistics
- [26] Plumbing Webmasters: Conversion Rate Optimization
- [27] Promoted Digital: Digital Marketing for Plumbers
- [28] r/smallbusiness: Most HVAC and Plumbing Companies
Frequently Asked Questions
Approximately 55% of plumbing leads come from Google Maps/GBP listings alone, with an additional 28% from organic search. Combined, Google generates roughly 83% of all plumbing leads for companies with optimized online presence.
SEO cost per lead for plumbing companies averages $10-40 long-term, compared to $30-120 for PPC. While SEO requires 3-6 months to produce results, the compound effect means cost per lead decreases over time rather than remaining fixed like paid advertising.
Only 26% of plumbing companies actively invest in SEO according to Marketing LTB data. This means 74% of the market is not competing for organic search visibility, creating a significant opportunity for companies that invest now. Additionally, 70% of plumbers report being unhappy with their current SEO provider.
No, the vast majority are not. According to the 5W AI Visibility Index, 87% of independent plumbing contractors have zero AI citation share in their metro area. Only 1.2% of local businesses are recommended by AI search tools like ChatGPT and Perplexity, and it is up to 30x harder to appear in AI results compared to Google local search.
Google Business Profile signals account for 32% of local pack ranking weight, making them one of the most important factor. Review signals follow at 20%, and on-page signals at 15%. Combined, GBP optimization and review strategy account for over half of what determines your Local Pack position.
Want to Know Where You Stand?
Our free SEO audit shows you exactly how your plumbing company performs across Google Maps, reviews, website, and AI search — with specific action items to improve. Built by a data-obsessed plumber SEO agency that lives and breathes these numbers.
Get My Free Plumbing SEO AuditNo contracts. No obligations. Just data.