
- Convenience now shapes the hire: 80% of surveyed homeowners factor online booking into provider choice, while 96% expect a professional, user-friendly website.
- The phone handoff is a major leak: Invoca's home-services benchmark put phone-lead conversion at 46%, but only 61% of callers in its cross-industry dataset spoke with a person.
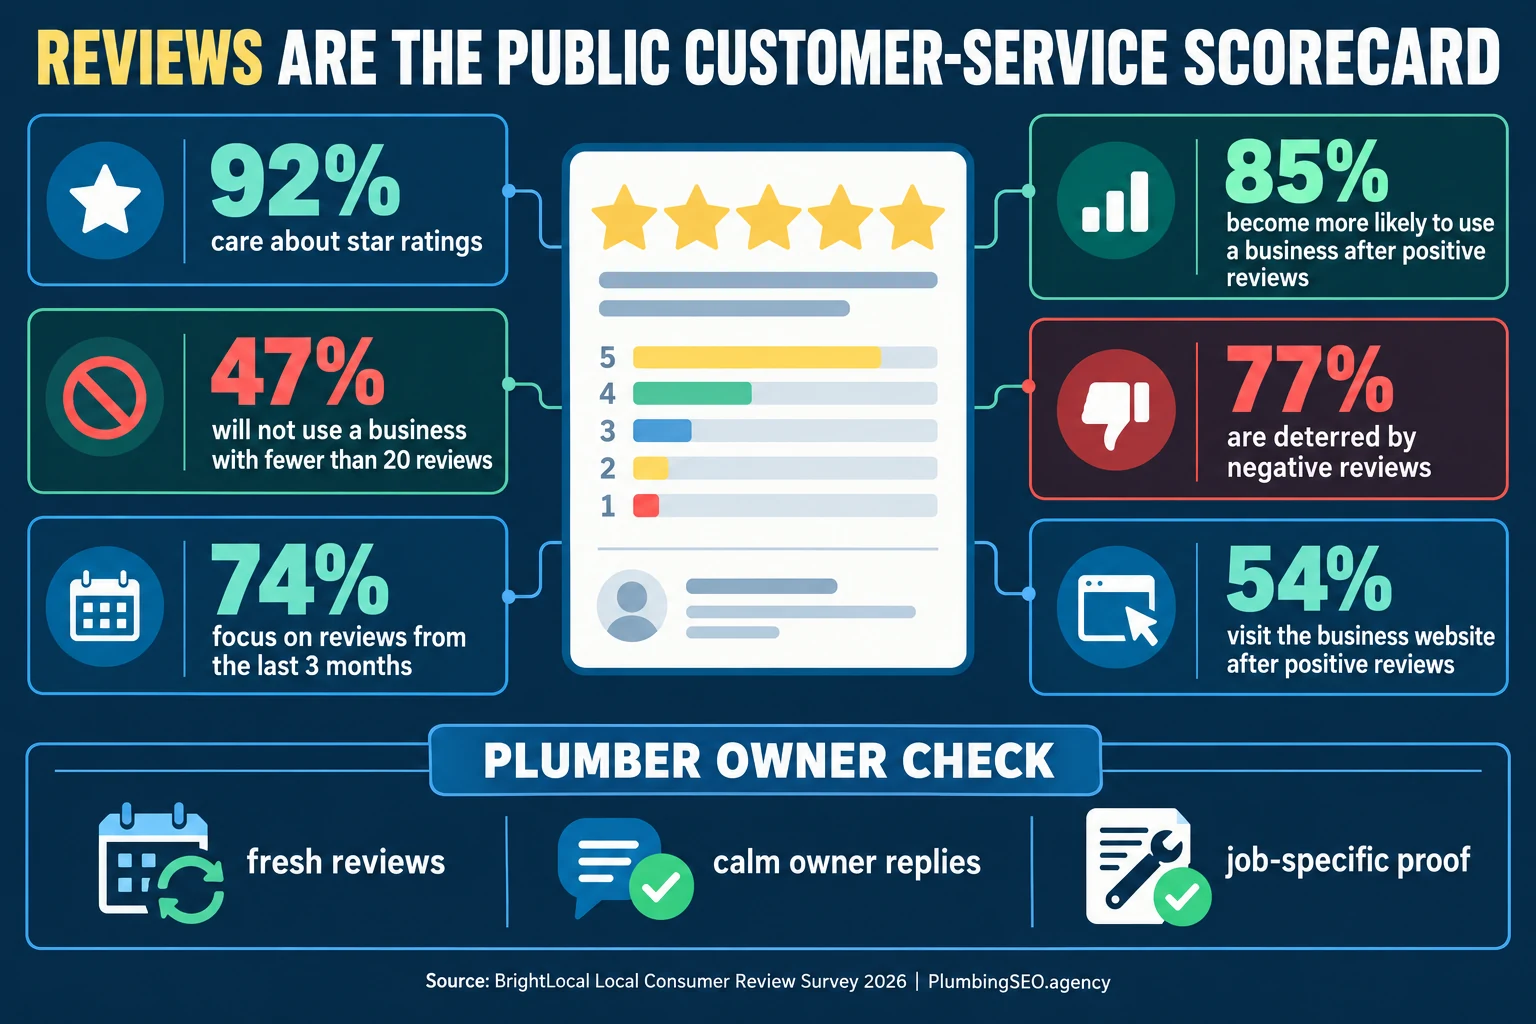
- Reviews are public customer-service evidence: 92% of consumers care about star ratings, and 74% focus on reviews from the previous three months.
- Use benchmarks as guardrails: track your own answer rate, response time, qualified-call rate, booking rate, repeat work, complaints, and review themes by source and service.
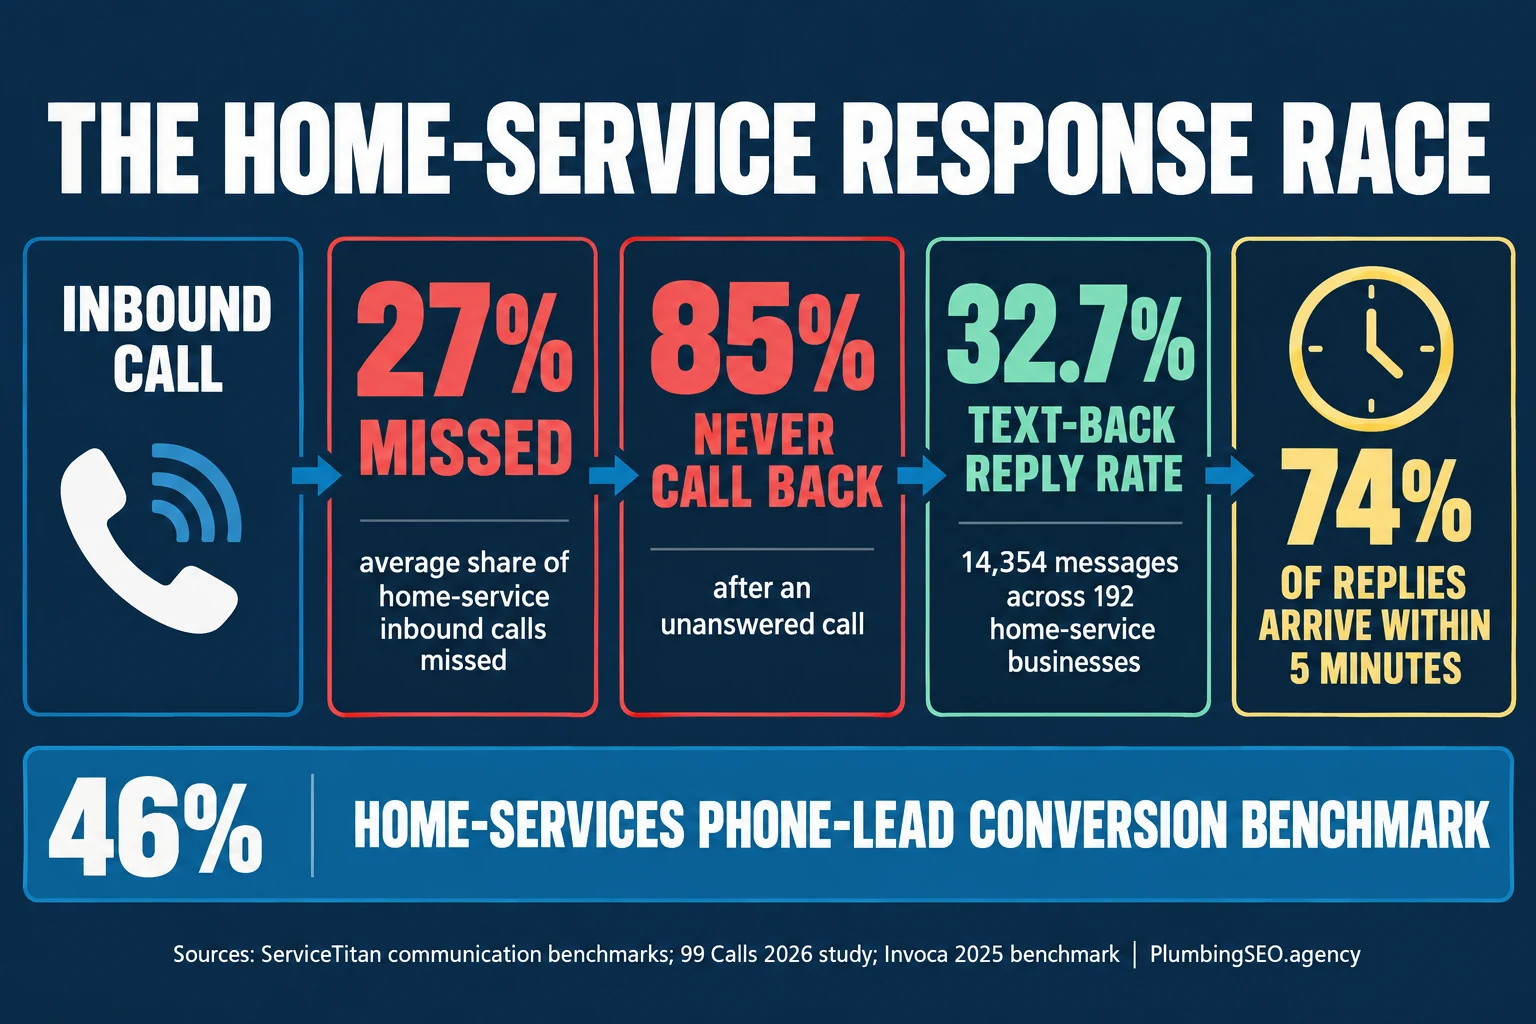
Plumbing customer service starts before the repair. It begins when a homeowner finds the company, tries to call or book, asks whether someone can come today, and decides whether the person answering sounds organized enough to trust inside the home.
This guide brings together 75 numbered statistics from home-service research, call-performance datasets, local-review studies, customer-experience surveys, and digital benchmarks. The plumbing-specific data is limited, so every table identifies scope. A home-services benchmark can help you spot a leak, but it should never be presented as a guaranteed result for one plumbing shop.
How to read customer-service benchmarks without fooling yourself
There is no credible universal “good plumber customer service score.” Emergency drain calls behave differently from planned repipes. A two-truck shop cannot staff the phone like a regional call center. One platform counts a booking; another measures a qualified lead or a customer who merely says they would rehire.
The useful chain is simple: search or referral, contact attempt, answer or acknowledgment, qualification, appointment, arrival, repair, payment, follow-up, review, and repeat work. A plumbing lead-tracking system should preserve that chain instead of stopping at calls and form submissions.
1. Homeowner customer-service expectations
Housecall Pro's 2025 survey of 1,040 U.S. homeowner decision-makers is one of the most directly relevant sources in this guide. It covers reputation, booking, website usability, technician identity, AI intake, visual proof, estimates, pricing, financing, and repeat intent. The findings are survey intentions—not guaranteed plumbing buying behavior—but they show how many small service details now influence trust.
| # | Homeowner benchmark | Value | Source | Scope |
|---|---|---|---|---|
| 1 | Homeowner decision-makers surveyed | 1,040 | Housecall Pro, 2025 | U.S. online survey |
| 2 | Homeowners willing to pay more for a pro with a better service reputation | Over 70% | Housecall Pro | Stated willingness |
| 3 | Homeowners who would refer a pro after an excellent experience | 73% | Housecall Pro | Referral intention |
| 4 | Homeowners factoring online booking into provider choice | 80% | Housecall Pro | Provider selection |
| 5 | Homeowners expecting a user-friendly, professional website | 96% | Housecall Pro | Website expectation |
| 6 | Millennials' likelihood versus boomers to rehire based on ease | Over 3× | Housecall Pro | Generational comparison |
| 7 | Homeowners appreciating the technician's name and photo before arrival | Nearly 60% | Housecall Pro | Pre-arrival communication |
| 8 | Homeowners comfortable with AI handling initial inquiries | 53% | Housecall Pro | Initial inquiry only |
| 9 | Homeowners expecting photo or video proof after work | 68% | Housecall Pro | Post-job proof |
| 10 | Homeowners saying visual work proof would be nice to receive | 28% | Housecall Pro | Separate response group |
| 11 | Homeowners saying they would hire the same company again | 68% | Housecall Pro | Repeat-hire intention |
| 12 | Homeowners influenced by visuals of past work | 92% | Housecall Pro | Source graphic |
| 13 | Homeowners saying instant estimates influence hiring | 93% | Housecall Pro | Source graphic |
| 14 | Homeowners frustrated by hidden costs | 77% | Housecall Pro | Pricing communication |
| 15 | Homeowners expecting payment plans or financing options | 55% | Housecall Pro | Financing expectation |
| 16 | Homeowners who value useful tips from technicians | 70% | Housecall Pro | Technician education |
What this means for plumbers: customer service is a sequence of expectation-setting moments. Confirm the request, state the next step, send the technician identity, communicate delays, explain options, document the work, and make the invoice easy to understand. Your plumbing website trust signals should preview that experience before the call.
2. Calls, response time, and booking statistics
Plumbing demand is often urgent, which makes the office handoff unusually important. Invoca's 2025 benchmark used more than 60 million calls across industries, including a home-services segment. ServiceTitan's older platform study covered more than 3,000 trade businesses. The 99 Calls study examined 14,354 text-back messages. These datasets measure different things, so do not combine their percentages into one funnel.
| # | Call or booking benchmark | Value | Source | Scope |
|---|---|---|---|---|
| 17 | Calls analyzed for Invoca's call-performance reporting | 60M+ | Invoca via Supply House Times, 2025 | Dataset size |
| 18 | Home-services phone leads converting during the call | 46% | Invoca, 2025 | Multiple home-service trades |
| 19 | Phone leads converting during the call across industries | 37% | Invoca, 2025 | Cross-industry |
| 20 | Callers who spoke with a person | 61% | Invoca, 2025 | Cross-industry |
| 21 | Calls from digital marketing that were qualified leads | 35% | Invoca, 2025 | Cross-industry |
| 22 | Range in call answer rates across measured industries | 54–69% | Invoca, 2025 | Industry range |
| 23 | Phone calls rated excellent by contact-center managers | 28% | Invoca, 2025 | Manager rating |
| 24 | Agents who asked leads to buy or book | 35% | Invoca, 2025 | Observed call behavior |
| 25 | Trade businesses in ServiceTitan's call-booking analysis | 3,000+ | ServiceTitan, 2022 | Platform dataset |
| 26 | Typical call-booking rate in that trade-business analysis | 42% | ServiceTitan, 2022 | Multiple trades |
| 27 | Illustrative annual revenue linked to a five-point booking improvement for shops with 5–14 technicians | About $100K | ServiceTitan, 2022 | Estimate, not guarantee |
| 28 | Missed-call text messages analyzed | 14,354 | 99 Calls, 2026 | Study sample |
| 29 | Home-service businesses represented | 192 | 99 Calls, 2026 | Study sample |
| 30 | Reply rate to missed-call text-back messages | 32.7% | 99 Calls, 2026 | Home-service businesses |
| 31 | Share of text-back replies arriving within five minutes | 74% | 99 Calls, 2026 | Among replies |
| 32 | Directional value of an inbound home-services call | $300–$400 | Nextiva | Directional estimate |
| 33 | Callers cited as unlikely to leave voicemail after no answer | 82% | Nextiva | Directional benchmark |
| 34 | Estimated paid-channel ROI loss associated with poor call handling | 30% | Nextiva | Directional estimate |
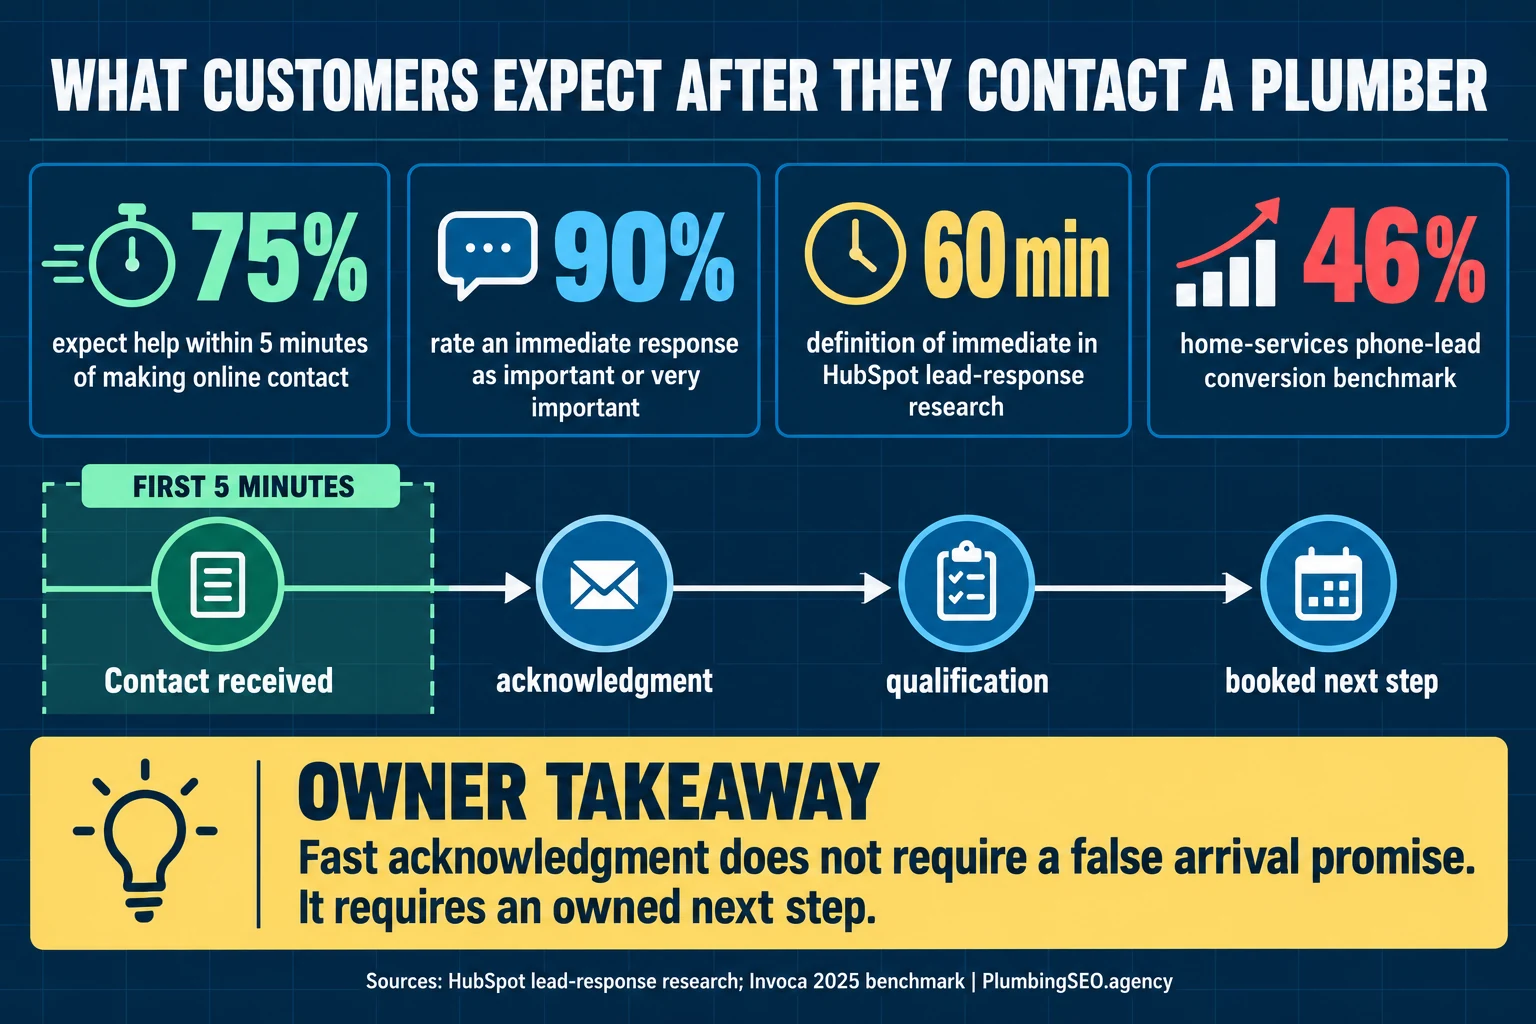
What this means for plumbers: live answer is valuable, but a recovery path matters because crews drive, work under sinks, and handle other customers. Use routing, overflow coverage, text-back, urgency tags, and one named owner for every reply. The practical workflow is covered in our missed-call recovery guide for plumbers.
If your reports stop at call volume, connect the conversation to the customer record with a plumbing lead CRM. The goal is not more dashboard activity. It is to see why qualified calls book, stall, or get lost.
3. Review and reputation statistics
Reviews sit between customer service and local marketing. BrightLocal's 2026 U.S. Local Consumer Review Survey shows that consumers look at rating, count, recency, positivity, owner responses, and multiple platforms. That makes reviews a customer-service feedback channel and a pre-call trust filter.
| # | Review benchmark | Value | Source | Why it matters |
|---|---|---|---|---|
| 35 | Consumers who read reviews for local businesses | 97% | BrightLocal, 2026 | Reviews are mainstream research |
| 36 | Consumers who always read reviews while browsing for businesses | 41% | BrightLocal, 2026 | Frequent behavior |
| 37 | Average number of review sites consumers use | 6 sites | BrightLocal, 2026 | Trust is cross-platform |
| 38 | Consumers using Google for local reviews and recommendations | 71% | BrightLocal, 2026 | Google remains central |
| 39 | Consumers using ChatGPT or other AI tools for local recommendations | 45% | BrightLocal, 2026 | Discovery is changing |
| 40 | Consumers using Apple Maps for local recommendations | 27% | BrightLocal, 2026 | Do not ignore map ecosystems |
| 41 | Consumers who will not use a business with fewer than 20 reviews | 47% | BrightLocal, 2026 | Review count is a threshold |
| 42 | Consumers willing to use a business with five or fewer reviews | 9% | BrightLocal, 2026 | Thin profiles face friction |
| 43 | Consumers who care about star ratings | 92% | BrightLocal, 2026 | Rating affects shortlisting |
| 44 | Consumers who will only use businesses with 4.5 stars or more | 31% | BrightLocal, 2026 | High-rating threshold |
| 45 | Consumers who will only use businesses with four stars or more | 68% | BrightLocal, 2026 | Broad rating threshold |
| 46 | Consumers requiring a perfect five-star rating | 10% | BrightLocal, 2026 | Perfection is not universal |
| 47 | Consumers focused on reviews from the last three months | 74% | BrightLocal, 2026 | Recency matters |
| 48 | Consumers only swayed by reviews from the last week | 18% | BrightLocal, 2026 | Fresh proof matters to some |
| 49 | Consumers looking for reviews from the last two weeks | 32% | BrightLocal, 2026 | Freshness window |
| 50 | Consumers calling review positivity an important factor | 46% | BrightLocal, 2026 | Tone of feedback |
| 51 | Consumers calling review recency within the last month important | 44% | BrightLocal, 2026 | Recent operations are visible |
| 52 | Consumers calling a high star rating important | 42% | BrightLocal, 2026 | Headline trust signal |
| 53 | Consumers calling an owner response important | 37% | BrightLocal, 2026 | Replies are public service proof |
| 54 | Consumers more likely to use a business after positive reviews | 85% | BrightLocal, 2026 | Positive trust effect |
| 55 | Consumers deterred by negative reviews | 77% | BrightLocal, 2026 | Negative trust effect |
| 56 | Consumers doing further research after positive reviews | 66% | BrightLocal, 2026 | The review is not the finish line |
| 57 | Consumers ready to buy or book after positive reviews | 34% | BrightLocal, 2026 | High-intent subgroup |
| 58 | Consumers visiting the business website after positive reviews | 54% | BrightLocal, 2026 | Website must continue the trust |
| 59 | Consumers trusting reviews as much as personal recommendations | 49% | BrightLocal, 2026 | Reviews rival word of mouth for some |
What this means for plumbers: do not treat review management as a star-chasing project. Ask every eligible customer for honest feedback after a completed job, track recurring complaints, and reply calmly. Use our plumber review response templates as a starting point, then add the real service detail and a real next step.
4. Loyalty, convenience, and service-recovery statistics
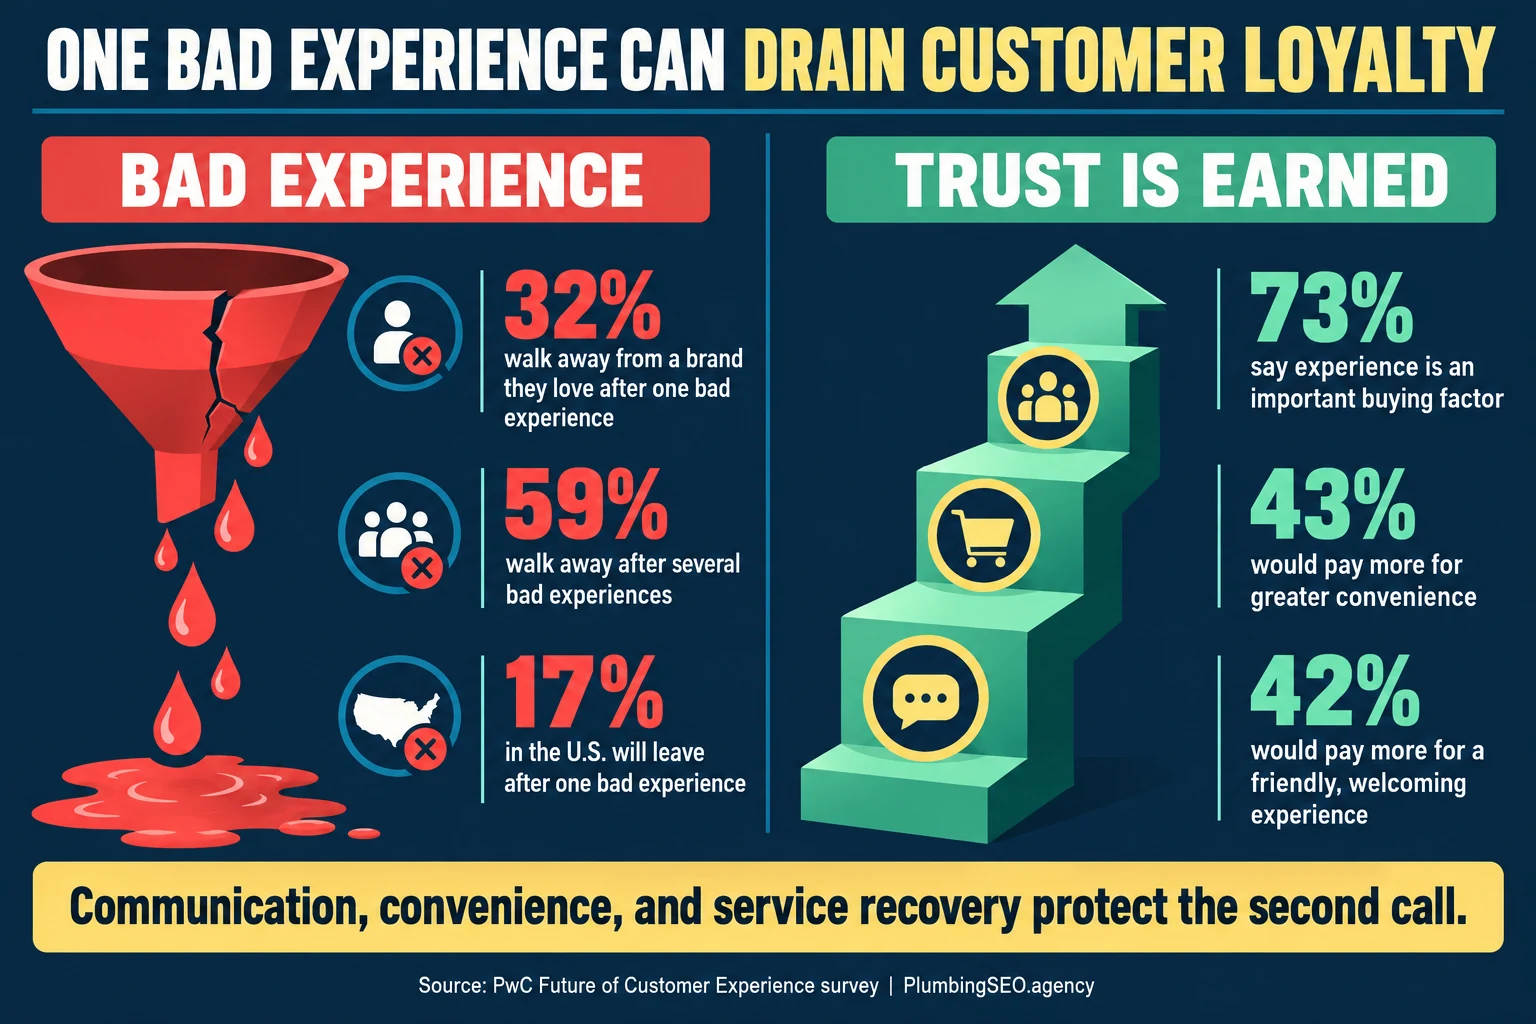
PwC's cross-industry Future of Customer Experience study is broader than plumbing and predates the home-service surveys above. It remains useful for framing the commercial risk of poor service: experience affects buying, convenience has value, and even a liked brand can lose customers after a bad interaction.
| # | Customer-experience benchmark | Value | Source | Plumbing interpretation |
|---|---|---|---|---|
| 60 | Consumers saying experience is an important buying factor | 73% | PwC | Service affects selection |
| 61 | Consumers who would leave a brand they love after one bad experience | 32% | PwC | One failure can damage loyalty |
| 62 | Consumers who would leave after several bad experiences | 59% | PwC | Repeated friction compounds |
| 63 | U.S. consumers who would leave after one bad experience | 17% | PwC | U.S. subgroup |
| 64 | Consumers willing to pay more for greater convenience | 43% | PwC | Ease can carry value |
| 65 | Consumers willing to pay more for a friendly, welcoming experience | 42% | PwC | Tone is part of perceived value |
Use complaints as operating data. Tag late arrival, no callback, unclear estimate, surprise charge, cleanup, repeat failure, property concern, and poor handoff separately. Then review frequency, severity, resolution time, and whether the customer returned. That makes customer service measurable without reducing people to a single satisfaction score.
5. Digital convenience, response, and lead-economics statistics
Customer service is affected by the tools around it. Online booking can reduce friction, mobile access makes the phone path essential, and expensive paid clicks raise the cost of unanswered or poorly handled leads. The final ten figures provide context from ServiceTitan, HubSpot, Pew Research Center, and LocaliQ.
| # | Digital-service benchmark | Value | Source | Scope |
|---|---|---|---|---|
| 66 | Consumers reported as expecting to book online | 70% | ServiceTitan, 2024 | Contractor booking context |
| 67 | Consumers looking for a new contractor more likely to choose one offering online booking | 94% | ServiceTitan, 2024 | Stated likelihood |
| 68 | Customers rating an immediate response as important or very important | 90% | HubSpot | Cross-industry |
| 69 | Customers defining an immediate response as 10 minutes or less | 60% | HubSpot | Cross-industry |
| 70 | U.S. adults owning any cellphone | 98% | Pew Research Center, 2025 | U.S. adults |
| 71 | U.S. adults owning a smartphone | 91% | Pew Research Center, 2025 | U.S. adults |
| 72 | Plumbing paid-search conversion rate | 7.63% | LocaliQ, 2025 | Configured campaign conversions |
| 73 | Plumbing paid-search click-through rate | 4.97% | LocaliQ, 2025 | Search campaigns |
| 74 | Plumbing paid-search cost per click | $10.49 | LocaliQ, 2025 | Campaign benchmark |
| 75 | Plumbing paid-search cost per lead | $129.02 | LocaliQ, 2025 | Campaign benchmark |
What this means for plumbers: support both phone and digital intake. Urgent pages should make click-to-call obvious; planned-project pages can offer short forms or online booking. Our analysis of forms versus click-to-call for plumbing websites explains how to match the path to the job.
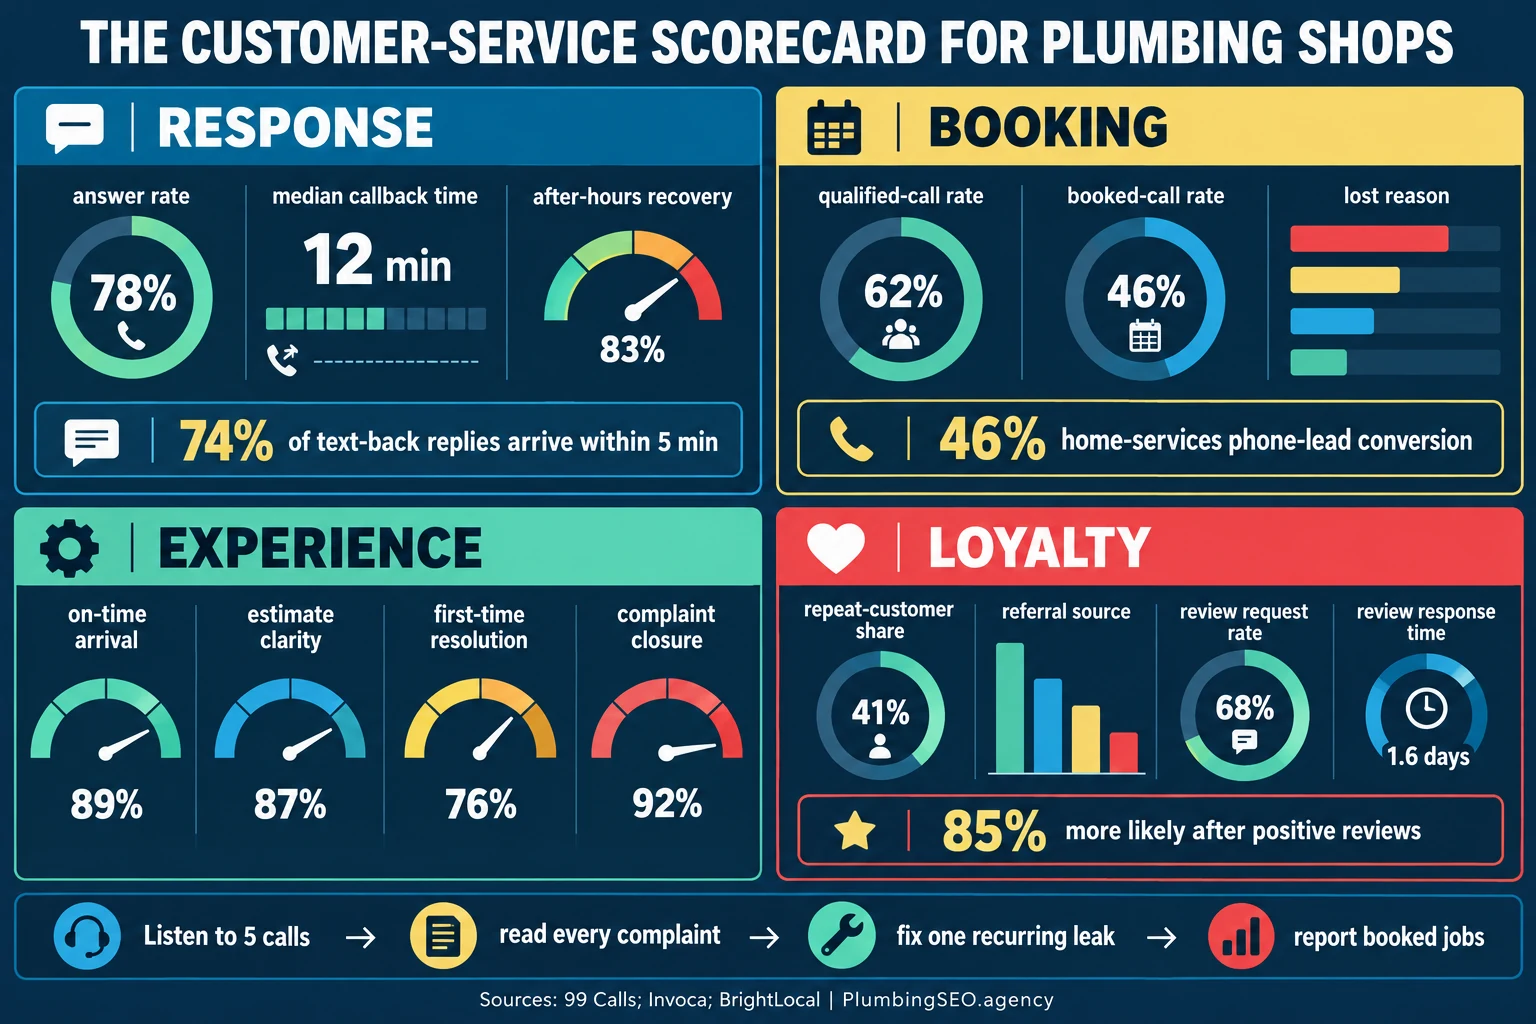
Build a plumbing customer-service scorecard that leads to action
A big survey number can get attention, but your own weekly numbers run the company. Keep the scorecard small enough that the owner, dispatcher, and service manager will actually review it.
1Response
Track total contact attempts, live answer rate, median first response, missed-call recovery, after-hours recovery, and abandoned calls. Separate business hours from nights and weekends.
2Qualification and booking
Track service-area fit, job type, urgency, qualified-call rate, booking ask, booked rate, cancellation, and the recorded reason each good opportunity was lost.
3Field experience
Track on-time arrival, delay communication, estimate approval, pricing questions, first-time resolution, repeat visit, cleanup concerns, and payment friction.
4Recovery
Track complaints by type, first acknowledgment time, assigned owner, resolution time, compensation where applicable, and whether the customer confirmed closure.
5Loyalty
Track repeat-customer share, maintenance-plan renewal, referral source, honest review requests, review response time, and service themes inside new reviews.
6Marketing connection
Connect source and landing page to answered calls, qualified leads, bookings, completed work, revenue, and reviews. Otherwise, strong lead generation can hide weak handling.
A practical weekly meeting
- Listen to five recent calls: one great call, one missed call, one lost lead, one complaint, and one high-value booking.
- Read every new review and every unresolved complaint.
- Choose one recurring leak to fix—routing, script, schedule updates, estimate clarity, cleanup, or follow-up.
- Assign one owner and one completion date.
- Report the change in booked jobs or service outcomes the following week.
Customer service and local SEO for plumbers meet in the same place: the homeowner's decision to call, book, review, refer, or keep searching. Rankings earn the chance. The service experience decides what happens next.
Methodology and source notes
This article was published October 21, 2026. We prioritized home-service surveys, first-party platform analyses, large call datasets, original local-review research, established consumer research, and sources with visible methodologies. The 75 numbered entries are organized by subject and retain the source's reported scope. We excluded unsupported claims that could not be traced to an identifiable publisher.
The source inventory below includes the principal datasets used in the numbered tables plus supporting sources used to cross-check definitions, digital behavior, review policy, and customer-experience context.
- Housecall Pro Home Service Customer Service Report (2025) — online survey of 1,040 U.S. homeowner decision-makers.
- Invoca call benchmarks reported by Supply House Times (2025) — analysis covering more than 60 million calls.
- ServiceTitan Call Booking Rate Analysis (2022) — platform analysis of more than 3,000 trade businesses.
- 99 Calls Missed-Call Text-Back Study (2026) — 14,354 messages across 192 home-service businesses.
- Nextiva Missed-Call Cost Analysis — directional call-value and voicemail benchmarks.
- BrightLocal Local Consumer Review Survey (2026) — U.S. consumer review behavior.
- PwC Future of Customer Experience — cross-industry buying, loyalty, and convenience research.
- ServiceTitan Online Booking Research (2024) — contractor booking expectations and provider-choice context.
- HubSpot Customer Service Statistics — cross-industry response expectations.
- Pew Research Center Mobile Fact Sheet (2025) — U.S. cellphone and smartphone ownership.
- LocaliQ Home Services Search Advertising Benchmarks (2025) — more than 3,200 campaigns from April 2024 through March 2025.
- Contentsquare Digital Experience Benchmarks (2026) — supporting context from thousands of sites, billions of sessions, and customer-service interactions.
- Unbounce Conversion Benchmark Report (2024) — supporting landing-page context from more than 41,000 pages.
- Google Business Profile Review Guidance — first-party guidance for review links and public owner replies.
- Qualtrics Online Review Statistics — supporting review-behavior context.
- Salesforce State of the Connected Customer — supporting cross-industry expectations and trust context.
Frequently asked questions
Start with live answer rate, median first response, missed-call recovery, qualified-call rate, booking rate, on-time arrival, repeat visit rate, complaint resolution time, repeat-customer share, and review themes. Connect every lead metric to booked and completed work.
As quickly as the company can reliably support, with urgent leaks and sewer backups first. A fast acknowledgment should identify the company, collect the issue and location, and give a clear next step. It should not promise an arrival time before dispatch confirms it.
There is no universal plumbing rate. ServiceTitan reported a 42% typical booking rate across more than 3,000 trade businesses in an older platform analysis, while Invoca reported a 46% phone-lead conversion benchmark for home services in 2025. Compare your company only after separating qualified calls, service area, hours, source, and job type.
They measure part of it. Reviews reveal themes such as communication, punctuality, pricing clarity, cleanliness, and repair outcomes, but they are not a complete operational dataset. Combine review themes with complaints, repeat visits, call recordings, callbacks, and repeat-customer behavior.
It is worth testing when live answer is not always possible. A 2026 study of 14,354 messages across 192 home-service businesses found a 32.7% reply rate, with 74% of replies arriving within five minutes. Text-back should support—not replace—human ownership and urgent-call escalation.
Use external figures as diagnostic guardrails. Compare your own metrics by service, source, time of day, new versus repeat customer, and booked outcome. Fix one recurring leak at a time and verify whether the change improves customer outcomes and completed revenue.
Are good plumbing leads leaking after the click?
We can review the SEO, call path, service pages, trust signals, and tracking that connect local searches to booked plumbing work.
Run My Free SEO Leak Check