
- Plumbing paid search is expensive: LocaliQ measured a $10.49 CPC and $129.02 cost per lead for plumbing campaigns in its 2025 home-services dataset.
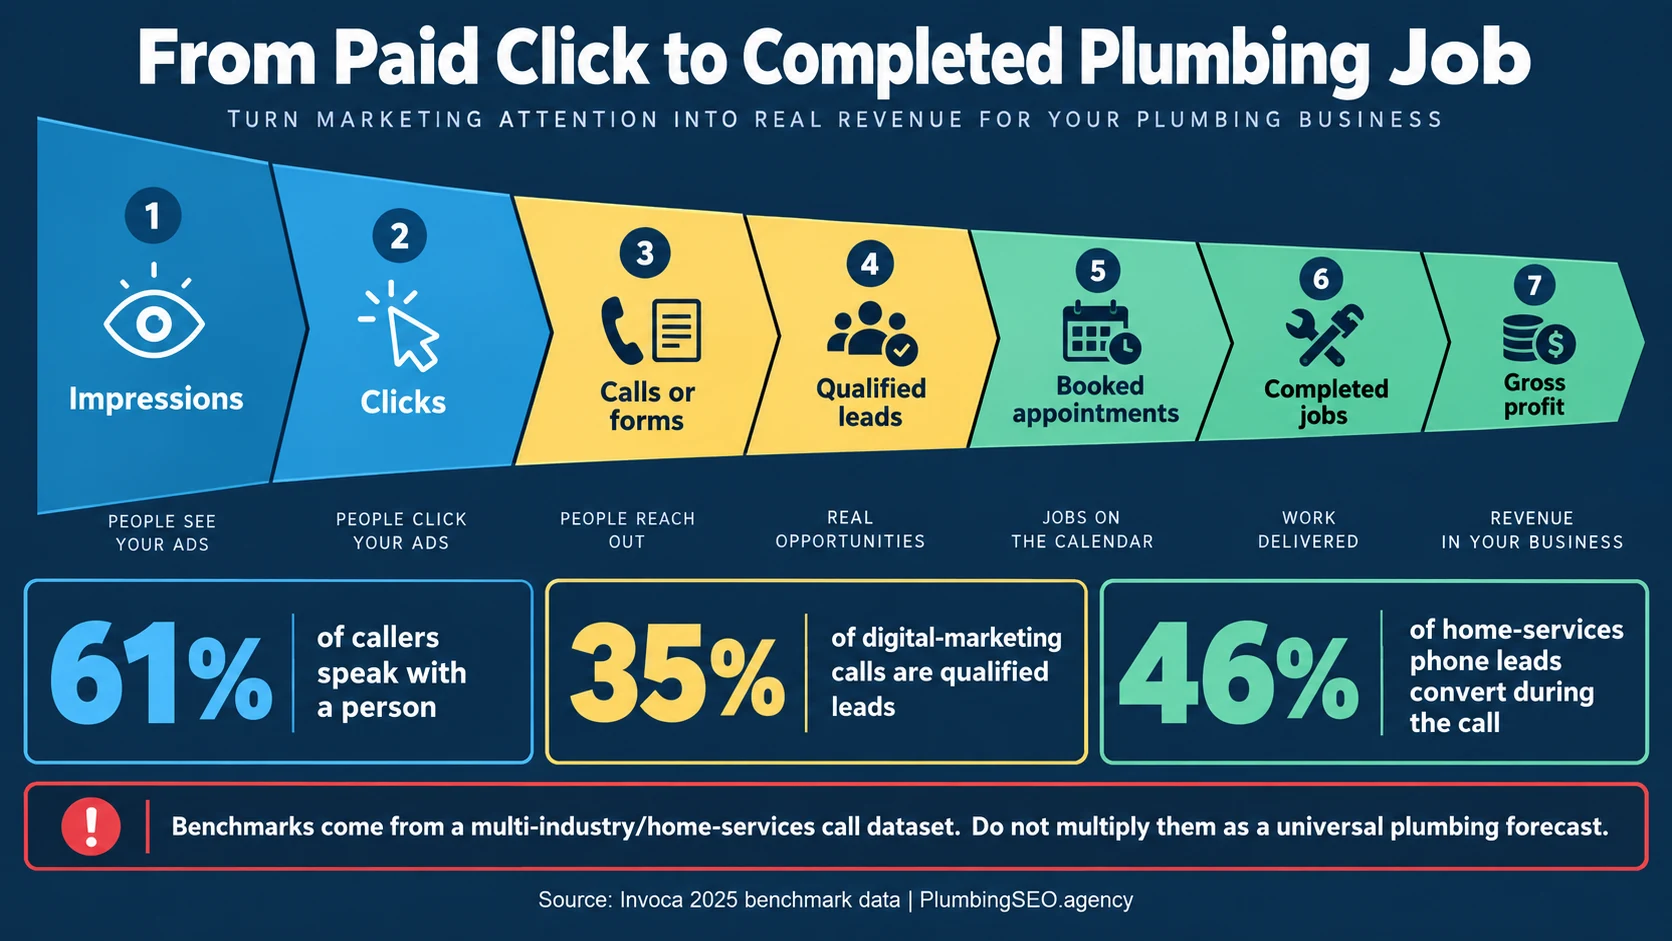
- The ad platform is only half the job: Invoca found that just 61% of callers across its multi-industry dataset spoke with a person, while 35% of agents asked the lead to buy or book.
- Judge ads by completed work: connect search term, call quality, answer rate, booking, completed revenue, and gross margin before raising or cutting budget.
A click does not pay payroll. A booked and completed plumbing job might. That is why this guide follows the whole line from the search result to the call, the dispatch board, the invoice, and the gross profit left after the work is done.
Below are 84 numbered data points from more than 15 source families. Plumbing-only figures are labeled as plumbing. Home-services and cross-industry figures are labeled too. Do not mix Search campaigns, Performance Max, Local Services Ads, raw leads, qualified calls, and booked jobs into one bucket. They are different fittings in the same system.
- Plumbing CPC was $10.49, versus $7.85 across home services in LocaliQ's matched 2025 campaign dataset (LocaliQ).
- Plumbing CPL was $129.02, about $38 above the all-home-services figure in that same dataset (LocaliQ).
- Across industries, 2025 search-ad CPC rose 12.88% year over year (WordStream).
- Google responsive search ads can use up to 15 headlines and 4 descriptions (Google Ads Help).
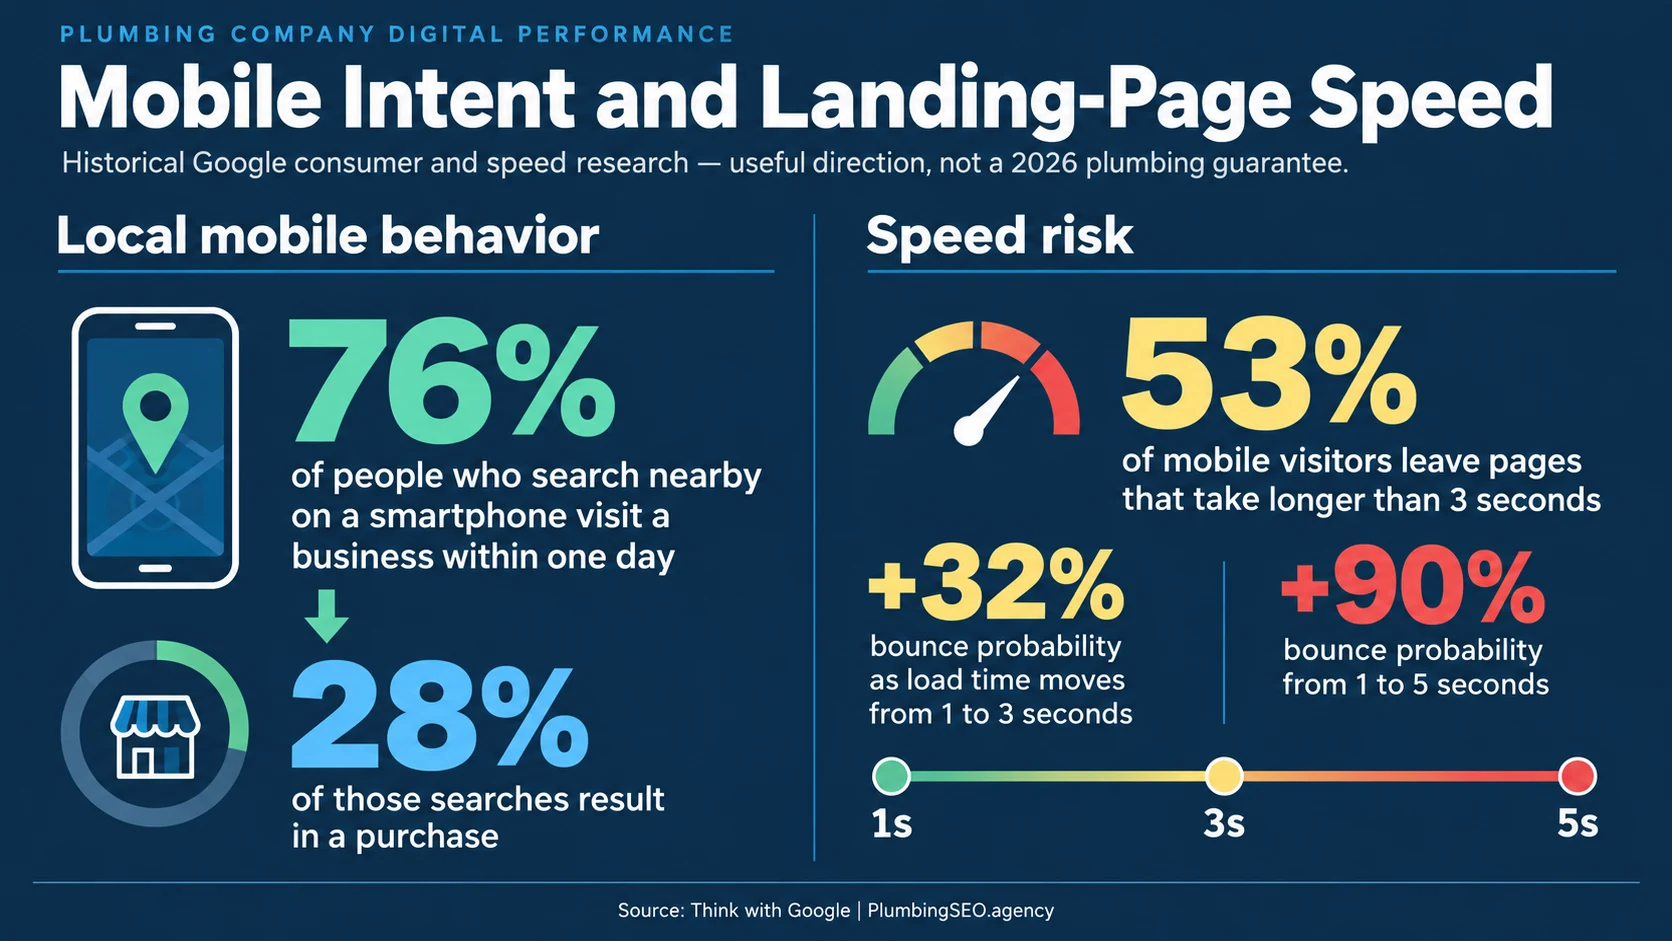
- 76% of people who searched nearby on a smartphone visited a business within a day in Google's local-search research (Think with Google).
- 53% of mobile visitors left pages that took longer than three seconds to load in historical Google research (Think with Google).
- Invoca analyzed more than 60 million calls for its 2025 call-performance reporting (Supply House Times summary).
- Only 61% of callers in the Invoca dataset spoke with a person (Invoca data).
- ServiceTitan's older trade-business analysis put typical call booking at 42% across more than 3,000 businesses (ServiceTitan).
- 80% of homeowners in a 2025 survey factored online booking into provider choice (Housecall Pro).
- Search advertising produced $102.9 billion, or 39.8%, of U.S. internet ad revenue in 2024 (IAB).
- The best final scorecard is not clicks. It is qualified calls, booked appointments, completed jobs, gross profit, and cost per completed job.
1. Plumbing paid-search benchmarks
LocaliQ analyzed more than 3,200 home-services search campaigns that ran from April 2024 through March 2025. Its plumbing row is one of the cleanest public apples-to-apples trade comparisons. A conversion can still be a call, form, or another configured action, so none of these figures equals a booked-job rate.
| # | Paid-search benchmark | Value | Source | Scope |
|---|---|---|---|---|
| 1 | Plumbing click-through rate | 4.97% | LocaliQ, 2025 | Plumbing search campaigns |
| 2 | Plumbing average cost per click | $10.49 | LocaliQ, 2025 | Plumbing search campaigns |
| 3 | Plumbing conversion rate | 7.63% | LocaliQ, 2025 | Configured conversions |
| 4 | Plumbing cost per lead | $129.02 | LocaliQ, 2025 | Not cost per booked job |
| 5 | Home-services average click-through rate | 5.59% | LocaliQ, 2025 | All measured home services |
| 6 | Home-services average cost per click | $7.85 | LocaliQ, 2025 | All measured home services |
| 7 | Home-services average conversion rate | 7.33% | LocaliQ, 2025 | Configured conversions |
| 8 | Home-services average cost per lead | $90.92 | LocaliQ, 2025 | All measured home services |
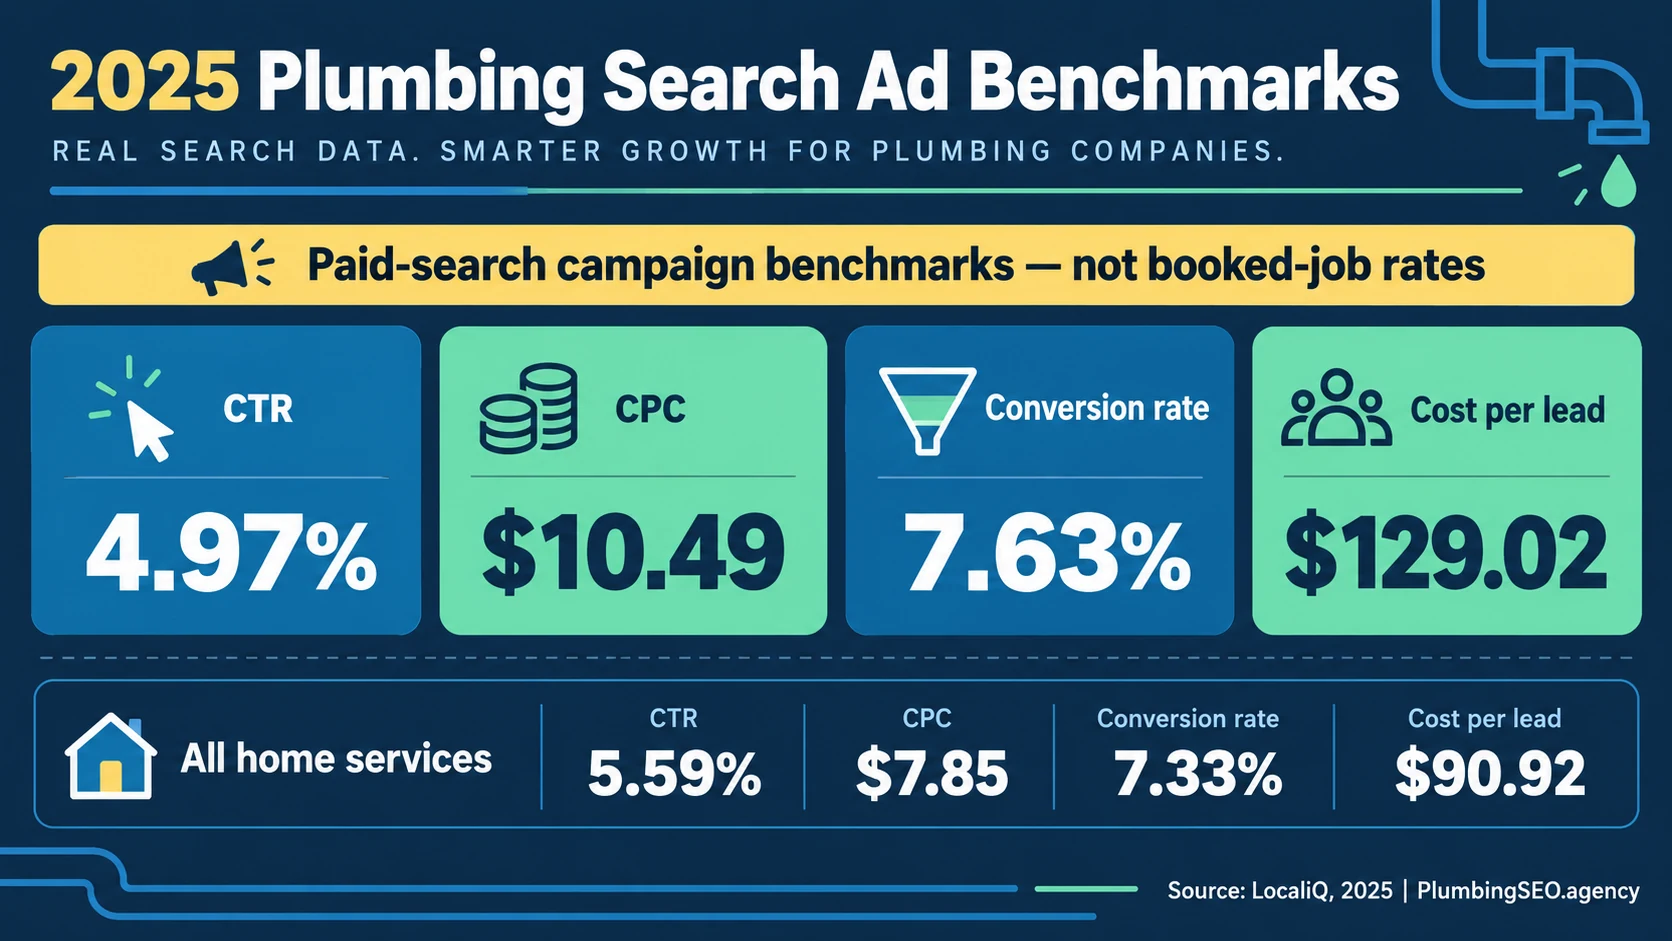
The practical reading is not “$129 is good” or “$129 is bad.” Ask what the lead needed, whether your team answered, whether it booked, what job was completed, and what margin remained. Our plumber cost-per-lead guide explains why a cheap lead can still be expensive.
2. Search advertising market and cost trends
Plumbers do not buy clicks in a vacuum. Auction pressure moves with broader advertiser demand. WordStream's annual benchmarks describe cross-industry Search campaigns, while IAB measures the U.S. digital advertising market. Use these figures to understand direction, not to replace your plumbing account data.
| # | Market benchmark | Value | Source | Scope |
|---|---|---|---|---|
| 9 | Average search-ad click-through rate | 6.66% | WordStream, 2025 | All measured industries |
| 10 | Average search-ad cost per click | $5.26 | WordStream, 2025 | All measured industries |
| 11 | Average search-ad conversion rate | 7.52% | WordStream, 2025 | All measured industries |
| 12 | Average search-ad cost per lead | $70.11 | WordStream, 2025 | All measured industries |
| 13 | Year-over-year CPC change | +12.88% | WordStream, 2025 | Cross-industry direction |
| 14 | U.S. internet advertising revenue | $258.6B | IAB, 2024 | All internet advertising |
| 15 | U.S. internet advertising annual growth | 14.9% | IAB, 2024 | Year over year |
| 16 | U.S. search advertising revenue | $102.9B | IAB, 2024 | Search format |
| 17 | Search share of U.S. internet ad revenue | 39.8% | IAB, 2024 | Format share |
When click prices rise, sloppy query matching and weak landing pages get punished faster. Build campaign groups around actual service economics, then maintain the negative keyword list for plumbing ads before paying to educate job seekers, DIY shoppers, and customers outside your service area.
3. Campaign controls, ad limits, and diagnostic signals
Google Ads gives you many knobs, but more settings do not automatically produce better leads. These platform facts matter because they define what can be tested and what the platform is actually scoring.
| # | Google Ads platform fact | Value | Source | Why it matters |
|---|---|---|---|---|
| 18 | Responsive search ad headline capacity | Up to 15 | Google Ads Help | Asset testing capacity |
| 19 | Responsive search ad description capacity | Up to 4 | Google Ads Help | Message testing capacity |
| 20 | Minimum responsive search ad headlines | 3 | Google Ads Help | Minimum asset requirement |
| 21 | Minimum responsive search ad descriptions | 2 | Google Ads Help | Minimum asset requirement |
| 22 | Quality Score scale | 1 to 10 | Google Ads Help | Keyword-level diagnostic |
| 23 | Quality Score diagnostic components | 3 | Google Ads Help | Expected CTR, relevance, landing page |
| 24 | Keyword match types documented by Google | 3 | Google Ads Help | Broad, phrase, exact |
| 25 | Location option concepts | 2 | Google Ads Help | Presence versus interest |
| 26 | Call conversion duration | Advertiser-defined | Google Ads Help | A call is not automatically qualified |
Do not fill all 15 headline slots with the same sentence wearing a different hat. Use assets to test service, location, urgency, trust, financing, availability, and a clear next step. Separate drain, sewer, emergency, and water-heater intent using the campaign logic in our Google Ads keyword segments for plumbers.
4. Local and mobile search intent
Plumbing searches often happen with a phone in hand and a problem already in progress. Google's local behavior research is older, so treat it as directional context. It still explains why tight geography, a visible phone number, and a fast route from query to service matter.
| # | Local/mobile behavior | Value | Source | Scope note |
|---|---|---|---|---|
| 27 | Nearby smartphone searchers who visited within one day | 76% | Think with Google | Historical local-search research |
| 28 | Nearby smartphone searches resulting in a purchase | 28% | Think with Google | Not plumbing-only |
| 29 | Smartphone searches related to location | 30% | Think with Google | Historical consumer behavior |
| 30 | U.S. adults owning any cellphone | 98% | Pew, 2025 | U.S. adults |
| 31 | U.S. adults owning a smartphone | 91% | Pew, 2025 | U.S. adults |
| 32 | Smartphone-only internet users | 16% | Pew, 2025 | No home broadband |
| 33 | Smartphone ownership in Pew's first survey | 35% | Pew, 2011 | Historical baseline |
For an emergency query, every extra choice adds friction. Keep the ad promise, page headline, service area, call button, hours, and dispatch expectation lined up. That does more for the owner than celebrating a pile of mobile clicks that never reached the schedule.
5. Landing-page speed and conversion benchmarks
The bid wins a visit. The landing page either continues the conversation or drops the wrench. Google speed research provides historical mobile behavior, while Unbounce offers a large cross-industry landing-page dataset. Neither is a plumbing-only conversion promise.
| # | Landing-page benchmark | Value | Source | Caveat |
|---|---|---|---|---|
| 34 | Mobile visitors leaving after load exceeds 3 seconds | 53% | Think with Google, 2017 | Historical mobile research |
| 35 | Bounce probability increase from 1 to 3 seconds | 32% | Think with Google, 2017 | Modeled probability |
| 36 | Bounce probability increase from 1 to 5 seconds | 90% | Think with Google, 2017 | Modeled probability |
| 37 | Slower DOM-ready time in bounced sessions | 55% | Think with Google, 2017 | Historical directional evidence |
| 38 | Fewer images in converted sessions | 38% | Think with Google, 2017 | Correlation in study data |
| 39 | Landing pages in benchmark dataset | 41,000+ | Unbounce, 2024 | Cross-industry |
| 40 | Unique visitors in benchmark dataset | 464M | Unbounce, 2024 | Cross-industry |
| 41 | Conversions in benchmark dataset | 57M | Unbounce, 2024 | Cross-industry |
A plumbing landing page needs one clear job. Match the service and city, show a tappable number, set availability expectations, add proof, and remove anything that delays the call. Review the broader plumbing website statistics if the ad account looks healthy but the website handoff does not.
6. Call quality and phone conversion statistics
Invoca's 2025 analysis covered more than 60 million calls. Its home-services conversion figure is especially relevant, but the surrounding benchmarks span industries. The main lesson is simple: a tracked call is not automatically a qualified plumbing opportunity, and a qualified call is not automatically booked.
| # | Call benchmark | Value | Source | Scope |
|---|---|---|---|---|
| 42 | Calls included in analysis | 60M+ | Invoca, 2025 | Multi-industry call data |
| 43 | Home-services phone leads converting during the call | 46% | Invoca, 2025 | Multiple home-service trades |
| 44 | Phone leads converting during the call across industries | 37% | Invoca, 2025 | Cross-industry |
| 45 | Callers who spoke with a person | 61% | Invoca, 2025 | Cross-industry |
| 46 | Digital-marketing calls that were qualified leads | 35% | Invoca, 2025 | Cross-industry |
| 47 | Industry range in call answer rates | 54% to 69% | Invoca, 2025 | Industry range |
| 48 | Calls rated excellent by contact-center managers | 28% | Invoca, 2025 | Manager rating |
| 49 | Agents asking the lead to buy or book | 35% | Invoca, 2025 | Observed call behavior |
Import qualified and booked outcomes back into the ad account when your systems allow it. At minimum, connect the ad click to call recording, disposition, booking, invoice, and revenue. Our call tracking guide for plumbers lays out the plumbing between those systems.
7. Booking, dispatch, and revenue handoff
ServiceTitan's call-booking analysis is older and platform-specific, but it shows why a small operational improvement can outweigh another round of bid tinkering. Google can send demand. It cannot make a CSR answer clearly, offer an appointment, or follow up on an estimate.
| # | Booking benchmark | Value | Source | Scope |
|---|---|---|---|---|
| 50 | Trade businesses in call-booking analysis | 3,000+ | ServiceTitan, 2022 | Platform businesses |
| 51 | Typical call booking rate | 42% | ServiceTitan, 2022 | Trade-business benchmark |
| 52 | Booking-rate improvement modeled | 5 points | ServiceTitan, 2022 | Illustrative improvement |
| 53 | Modeled revenue tied to five-point improvement | About $100,000 | ServiceTitan, 2022 | Businesses with 5 to 14 techs |
| 54 | Lower end of modeled technician cohort | 5 techs | ServiceTitan, 2022 | Scenario boundary |
| 55 | Upper end of modeled technician cohort | 14 techs | ServiceTitan, 2022 | Scenario boundary |
| 56 | Home-services phone-lead conversion premium over all industries | 9 points | Invoca, 2025 | 46% versus 37% |
| 57 | Share of observed agents not asking for a booking | 65% | Invoca, 2025 | Complement of 35% asking |
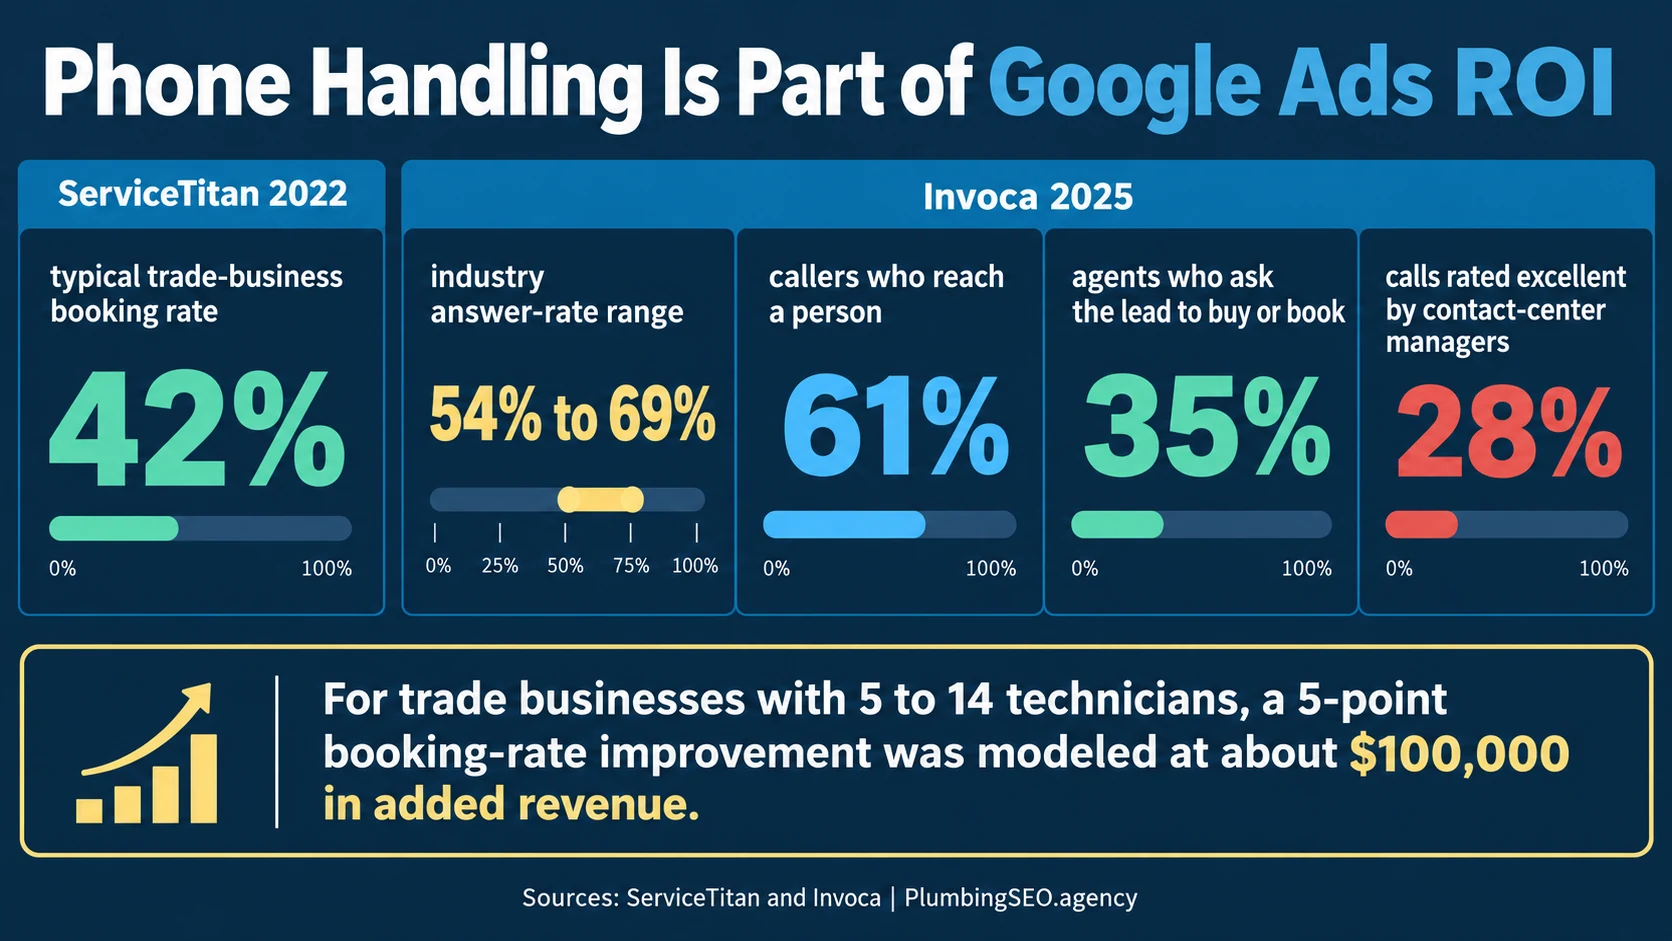
Review missed calls weekly and call quality monthly. Listen for service-area mismatches, weak scheduling asks, price objections, after-hours failures, and calls routed to voicemail. If 65% of agents in a broad dataset did not ask for the booking, there is probably more money hiding in the phone process than in one more headline variation.
8. Trust, reviews, and homeowner booking expectations
The click opens a credibility check. Homeowners want a site that works, a way to book, proof from recent customers, and signs that the company will communicate. These survey figures are not ad-platform metrics, but they describe the decision environment after a paid visitor lands.
| # | Homeowner expectation | Value | Source | Scope |
|---|---|---|---|---|
| 58 | Homeowner decision-makers surveyed | 1,040 | Housecall Pro, 2025 | U.S. homeowners |
| 59 | Expecting a professional, user-friendly website | 96% | Housecall Pro, 2025 | Survey expectation |
| 60 | Factoring online booking into provider choice | 80% | Housecall Pro, 2025 | Survey intention |
| 61 | Expecting photo or video proof after work | 68% | Housecall Pro, 2025 | Survey expectation |
| 62 | Frustrated by hidden costs | 77% | Housecall Pro, 2025 | Reported source graphic |
| 63 | Caring about reviews from the last three months | 74% | BrightLocal, 2026 | Local consumer survey |
| 64 | Writing a review after being asked | 65% | BrightLocal, 2026 | Local consumer survey |
| 65 | Expecting business owners to respond to reviews | 89% | BrightLocal, 2026 | Local consumer survey |
Put proof close to the call action: real reviews, license and insurance context where appropriate, service-area language, financing for larger work, real job photos, and what happens next. Trust should help the customer choose. It should not look like somebody emptied a badge drawer onto the page.
9. Device mix and access context
Do not assume “plumbing is mobile” means desktop does not matter. Statcounter's dated U.S. traffic snapshot shows both are substantial, and Pew measures device ownership rather than website traffic. Segment the account and the site by device instead of forcing these different measures into one conclusion.
| # | Device/access statistic | Value | Source | Definition |
|---|---|---|---|---|
| 66 | U.S. mobile share of platform traffic | 42.26% | Statcounter, Aug. 2026 | Traffic share |
| 67 | U.S. desktop share of platform traffic | 55.59% | Statcounter, Aug. 2026 | Traffic share |
| 68 | U.S. tablet share of platform traffic | 2.15% | Statcounter, Aug. 2026 | Traffic share |
| 69 | Mobile and tablet combined traffic share | 44.41% | Statcounter, Aug. 2026 | Sum of dated shares |
| 70 | Gap between desktop and mobile traffic share | 13.33 points | Statcounter, Aug. 2026 | Derived from source shares |
| 71 | U.S. smartphone ownership | 91% | Pew, 2025 | Ownership, not traffic |
Check CPC, conversion action, qualified lead rate, call duration, booking, and completed revenue by device. A mobile click may start the emergency call, while a desktop visit may support a planned repipe or commercial estimate. Your own account should settle that argument.
10. Google Search Ads versus Local Services Ads
Search Ads and Local Services Ads can both put a plumber near the top of Google, but the buying model and control are different. Search Ads generally charge for the click. LSA generally charges for a valid lead. Keep their reporting separate before comparing performance.
| # | Channel fact or benchmark | Value | Source | Interpretation |
|---|---|---|---|---|
| 72 | Standard Search Ads primary charge | Per click | Google Ads Help | Call or form not guaranteed |
| 73 | Local Services Ads primary charge | Per valid lead | Google LSA Help | Lead-based billing |
| 74 | Search keyword match types | 3 | Google Ads Help | Advertiser query control |
| 75 | Plumbing Search campaign CPC | $10.49 | LocaliQ, 2025 | Click cost, not lead cost |
| 76 | Plumbing Search campaign CPL | $129.02 | LocaliQ, 2025 | Configured lead |
| 77 | Headline LSA benchmarks cataloged in companion guide | 77+ | PlumbingSEO.agency, 2026 | Separate LSA dataset |
| 78 | Recommended reporting buckets | 2 | Google product distinction | Search Ads and LSA |
Google Search Ads
More control over keywords, match types, ad assets, bids, landing pages, and conversion setup. You pay for the click even when the visitor never calls.
Local Services Ads
Lead-based billing with a different ranking and dispute system. Review strength, responsiveness, proximity, profile quality, and availability can affect opportunity.
Run a separate scorecard for each channel. The companion LSA statistics for plumbers covers screening, lead costs, reviews, responsiveness, and disputes without muddying this Search campaign dataset.
11. Plumbing portfolio benchmarks by campaign and service line
Broad market reports rarely show how plumbing service lines behave inside managed accounts. Our separate 2026 PPC benchmark analysis summarizes a plumbing-only portfolio. Treat it as an observed dataset, not a promise for every city, budget, or account structure.
| # | Portfolio benchmark | Value | Source | Scope |
|---|---|---|---|---|
| 79 | Observed plumbing contractors | 524 | Plumbing PPC analysis, 2026 | Plumbing-only portfolio |
| 80 | Observed ad spend | $14.6M | Plumbing PPC analysis, 2026 | Portfolio total |
| 81 | Average non-branded plumbing Search CPL | $183 | Plumbing PPC analysis, 2026 | Non-branded leads |
| 82 | Performance Max CPL | $82 | Plumbing PPC analysis, 2026 | Different campaign type |
| 83 | General plumbing CPL | $161 | Plumbing PPC analysis, 2026 | Service category |
| 84 | Drain and sewer CPL | $166 | Plumbing PPC analysis, 2026 | Service category |
| 85 | Water-heater CPL | $256 | Plumbing PPC analysis, 2026 | Service category |
| 86 | Top-quartile CPL threshold | Under $107 | Plumbing PPC analysis, 2026 | Portfolio threshold |
The cheapest campaign is not automatically the best campaign. Performance Max can count and source leads differently from tightly controlled Search. Water-heater leads can cost more and still work when they produce replacement jobs with healthy tickets. Segment by service line, qualify the calls, and compare gross profit, not raw lead price.
12. Turn ad statistics into a plumbing profit scorecard
The report may look good, but the phone and job costing tell the truth. Build one monthly view that keeps platform diagnostics on the left and owner outcomes on the right.
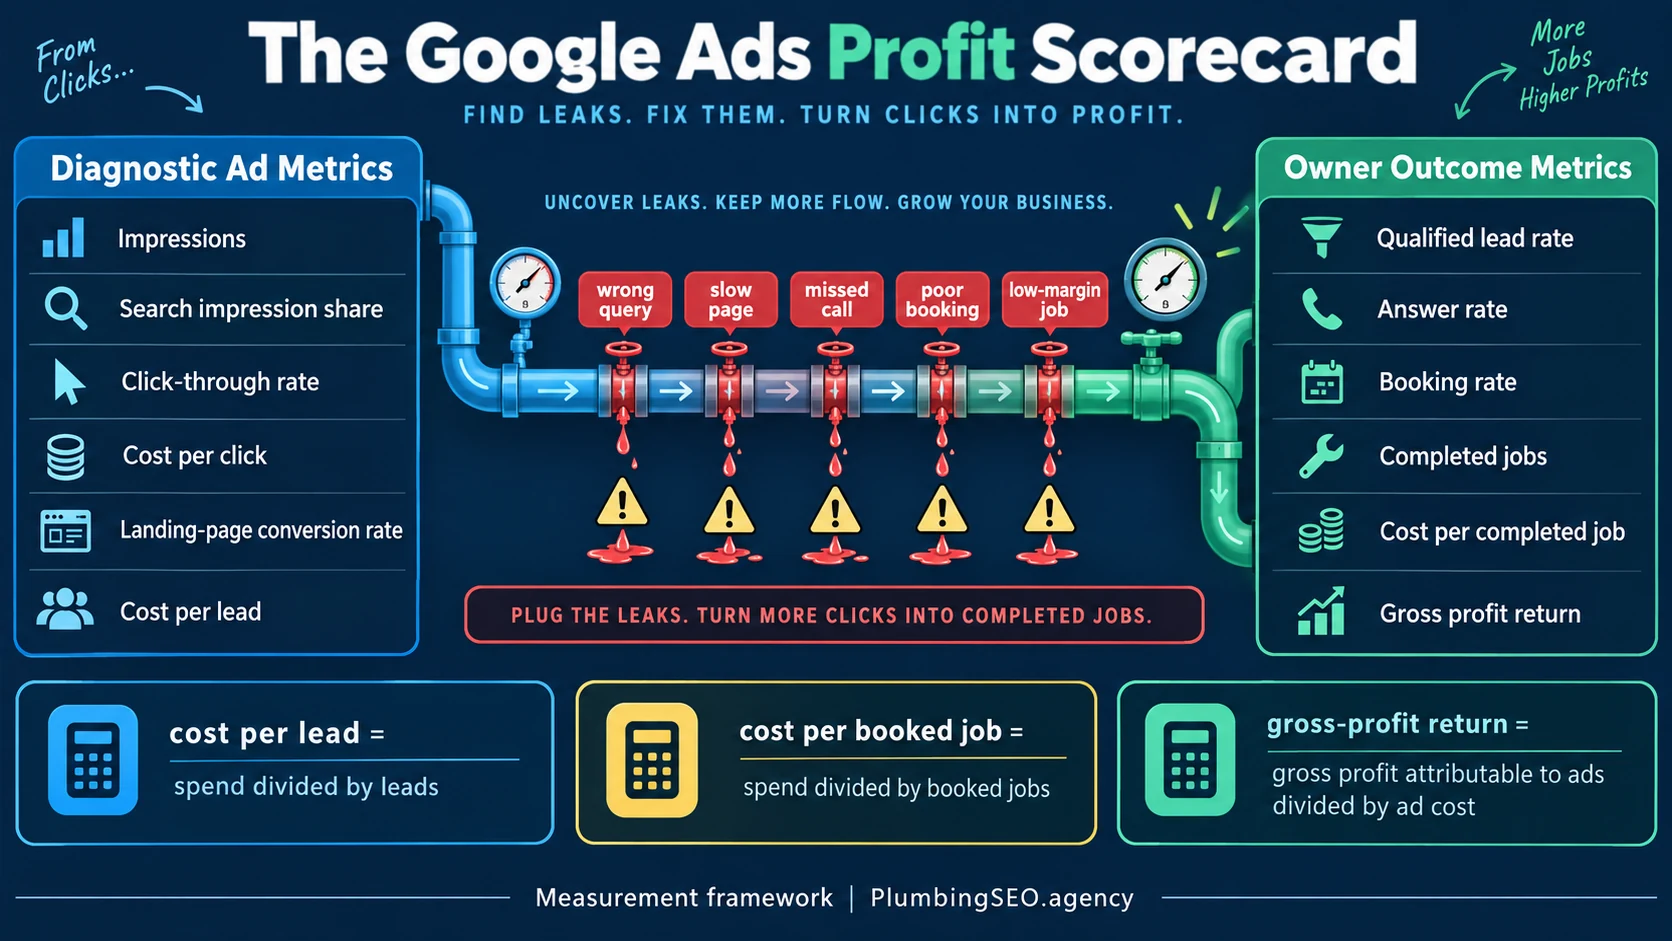
1Protect query quality
Review search terms, negatives, service areas, match types, and job intent. Separate emergency, drain, sewer, water-heater, and commercial demand.
2Measure the landing page
Track calls and forms by page, device, campaign, and service. Fix speed, promise mismatch, weak proof, and unclear calls to action.
3Grade every lead
Mark wrong number, spam, out of area, service mismatch, qualified, booked, canceled, completed, and sold. Raw conversions are only the first label.
4Audit the phone
Track answer rate, callback speed, booking asks, booking rate, and the reasons qualified customers do not schedule.
5Connect invoices
Match the original ad source to completed revenue, average ticket, job type, gross margin, callbacks, and cancellations.
6Move budget by profit
Feed campaigns that create profitable work your team can handle. Fix useful demand with a broken handoff. Cut traffic that never fits the shop.
| Metric | Formula | What it diagnoses |
|---|---|---|
| Cost per click | Ad spend / clicks | Auction and query cost |
| Cost per lead | Ad spend / tracked leads | Campaign plus page efficiency |
| Cost per qualified lead | Ad spend / qualified leads | Traffic fit and lead quality |
| Cost per booked job | Ad spend / booked jobs | Ads plus phone and booking handoff |
| Cost per completed job | Ad spend / completed jobs | True production acquisition cost |
| Gross-profit return | Attributed gross profit / ad cost | Whether the work funds the business |
If your reporting ends at CPL, keep going. Our guide to measuring plumbing marketing ROI shows how answer rate, booking, close rate, average ticket, and margin change the decision. If you want that scorecard connected to campaign management, see our Google Ads service for plumbers.
Methodology and source notes
This article was published October 4, 2026. It includes 86 numbered data points from plumbing campaign analyses, home-services datasets, cross-industry advertising reports, consumer surveys, call analytics, and first-party product documentation. We prioritized identifiable and linkable sources. Each numbered row includes a value, source, and scope note.
How to use the data: compare like with like. A click is not a lead. A tracked lead is not always qualified. A qualified call is not a booking. A booking is not always completed revenue. Home-services averages are not plumbing guarantees, and cross-industry numbers are context only. Derived values are labeled and calculated directly from cited source figures.
- LocaliQ 2025 home-services Search benchmarks
- WordStream 2025 Google Ads benchmarks
- IAB 2024 internet advertising revenue report
- Google Ads responsive search ad documentation
- Google Ads Quality Score documentation
- Google Ads keyword matching documentation
- Google Ads location options documentation
- Google Ads call conversion documentation
- Think with Google local-search research
- Think with Google mobile speed research
- Pew Research Center Mobile Fact Sheet
- Unbounce Conversion Benchmark Report
- Invoca call data reported by Supply House Times
- ServiceTitan call-booking analysis
- Housecall Pro homeowner survey
- BrightLocal consumer review survey
- Statcounter U.S. platform traffic snapshot
- Google Local Services Ads billing documentation
- Plumbing PPC portfolio analysis
Frequently asked questions about Google Ads for plumbers
LocaliQ reported a $10.49 average CPC for plumbing search campaigns in its 2025 home-services dataset. Your cost can differ sharply by city, service, competition, match type, schedule, and emergency intent.
LocaliQ measured 7.63% for plumbing paid-search campaigns. Compare only when conversion definitions match. An account counting every short call should not be compared with one counting qualified service requests or booked jobs.
LocaliQ reported $129.02 for plumbing in 2025. A separate plumbing portfolio analysis reported $183 for non-branded Search. The gap shows why source, campaign type, conversion definition, geography, and service mix must stay attached to the number.
Track calls for diagnosis, but optimize business decisions around qualified leads, bookings, completed jobs, revenue, and gross profit. A long call can still be out of area or for a service you do not provide.
Sometimes, but they use different billing and control models. Search Ads usually charge per click, while LSA generally charges per valid lead. Compare qualified lead cost, booking rate, completed-job cost, and profit separately for each channel.
Review search terms, spend anomalies, missed calls, and location quality weekly. Review qualified lead cost, booking, completed revenue, and gross profit monthly. Use a longer window when lead volume is low so one large job or bad week does not control the decision.
Are paid clicks turning into profitable plumbing jobs?
Get a practical review of search terms, landing pages, call tracking, local visibility, and the leaks between ad spend and booked work.
Review Google Ads for Plumbers