
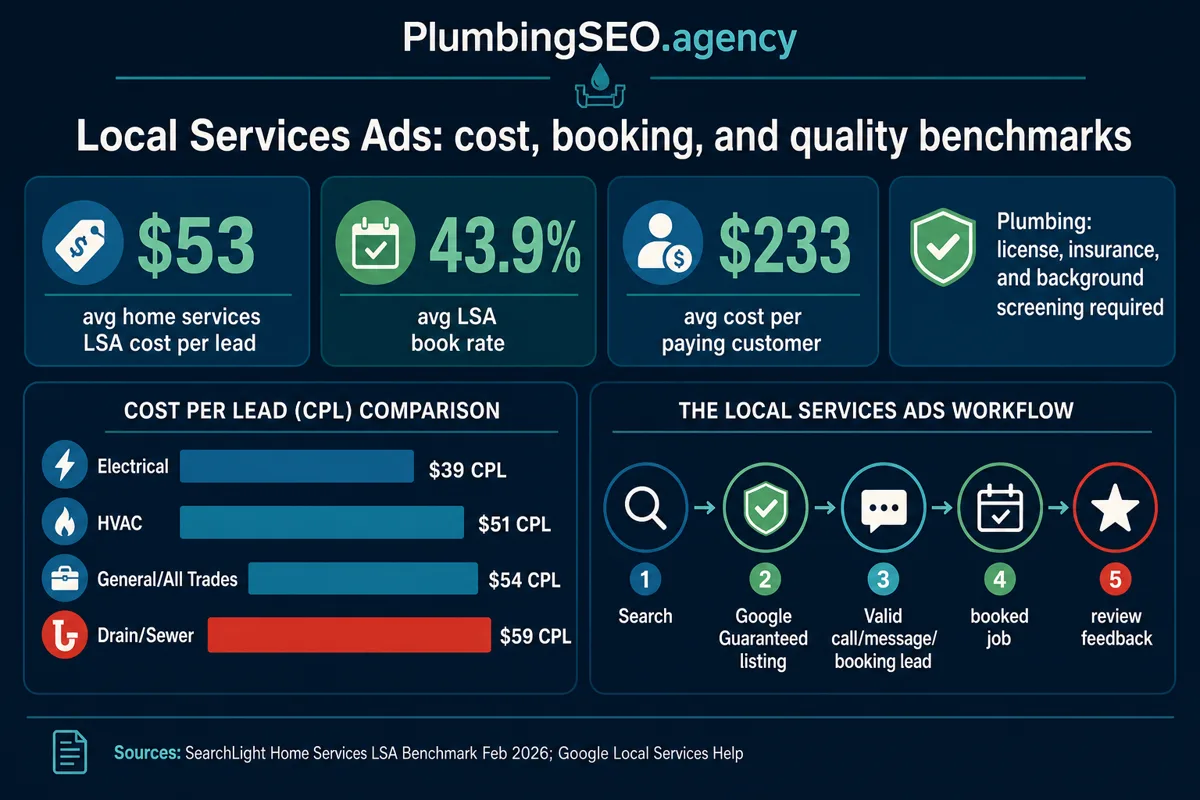
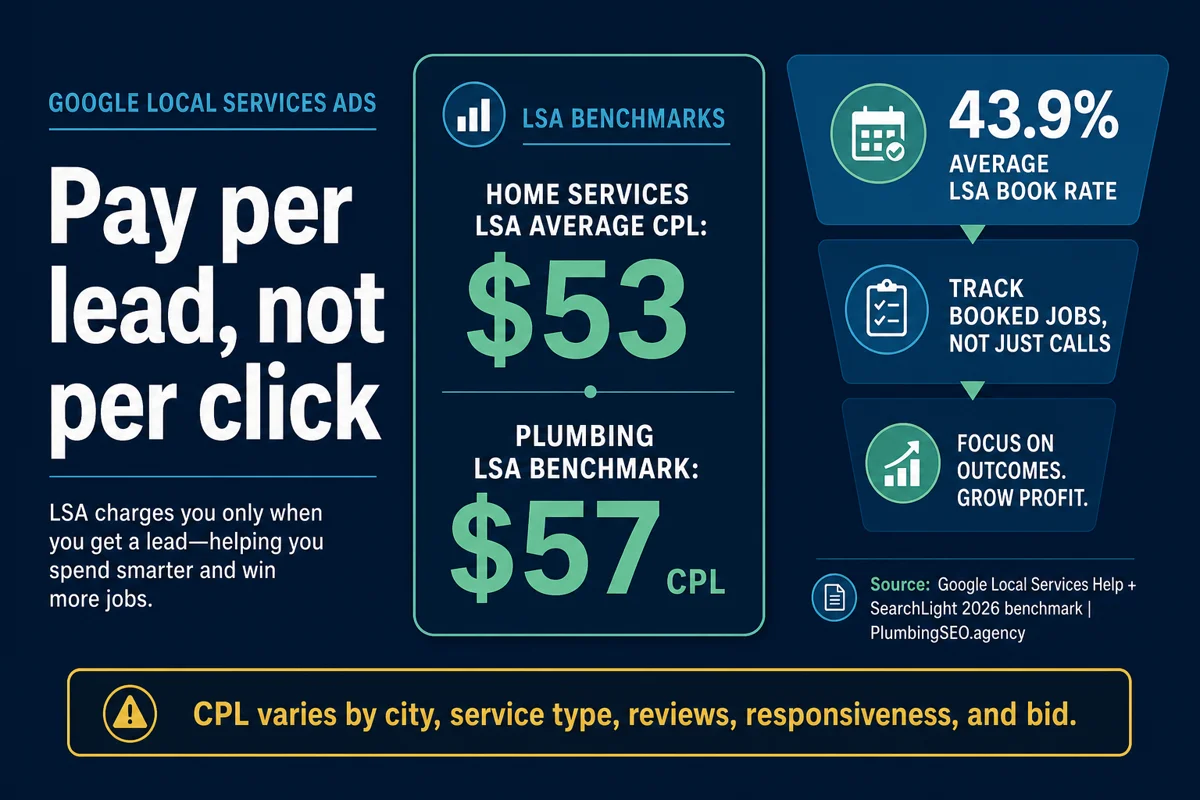
- Home-services Local Services Ads averaged $53 per lead in SearchLight's February 2026 benchmark; the plumber slice averaged $57 per lead, 44.5% booked appointments, and 6.85x closed ROAS.
- Google's own documentation matters as much as cost: plumbers must clear license, insurance, and background screening, and Google says verification often takes 3-4 weeks.
- Use LSAs for urgent calls, but do not let them replace plumbing SEO: reviews, landing pages, call tracking, and local organic visibility decide whether paid leads become profitable jobs.
The 2026 plumber benchmark answer: Local Services Ads averaged $57 per lead, a 44.5% booking rate, and 6.85x closed ROAS across 230 plumbing accounts and $2.03 million in measured spend in SearchLight's February 2026 dataset. Treat those as directional comparison points, not guarantees for every city or service line.
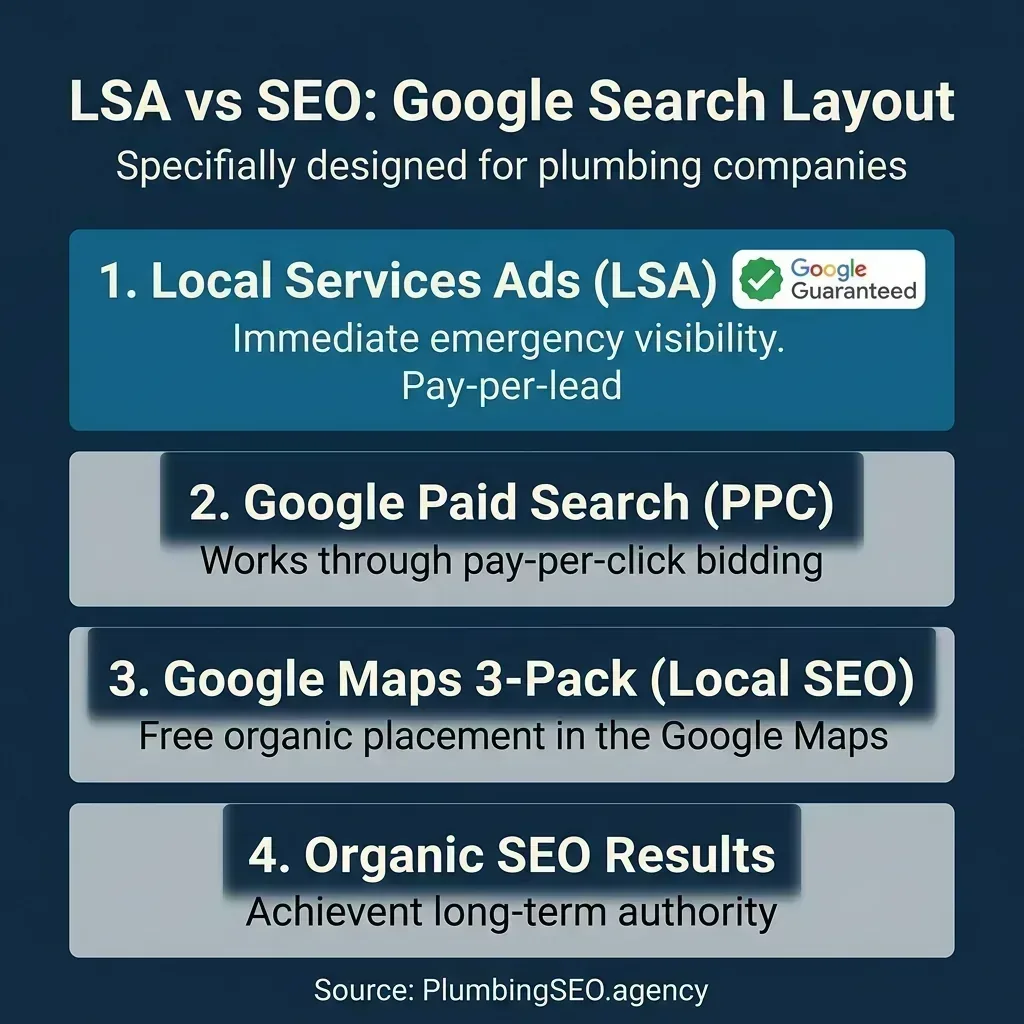
Local Services Ads can put a plumbing company above the map pack when a homeowner searches for an emergency plumber, clogged drain, water heater repair, or leak repair. That placement is powerful, but it is also easy to misunderstand: Google charges for valid leads, not clicks, and the profit is decided after the phone rings.
This source-cited roundup translates current Local Services Ads benchmarks into plumber-owner decisions: what a lead should cost, what booking rate to expect, what screening slows launch, how credits work, and where LSAs fit beside organic local search.
1 Cost and Booking Benchmarks for Plumber LSAs
The most useful LSA number is not cost per lead by itself. A $57 lead is excellent if the call is answered, booked, dispatched, and matched to revenue. It is expensive if missed calls, weak intake, or wrong service areas turn it into dead spend.
| Benchmark | Value | Plumber-owner meaning | Source |
|---|---|---|---|
| Observed LSA spend sample | $6.72M | Large enough to use as a directional home-services benchmark. | SearchLight |
| Contractors in benchmark | 888 | Includes multiple trades and enough accounts to compare categories. | SearchLight |
| Leads tracked | 126,650 | Benchmarks reflect real lead volume, not a small anecdotal sample. | SearchLight |
| Home-services average LSA CPL | $53 | Use as a blended baseline before market and trade adjustments. | SearchLight |
| Plumbing average LSA CPL | $57 | A plumber paying materially above this needs a market or close-rate explanation. | SearchLight |
| Plumbing accounts in sample | 230 | The plumber benchmark is not only inferred from HVAC or general contractors. | SearchLight |
| Plumbing LSA spend | $2.03M | Enough spend to show how plumber costs behave in active markets. | SearchLight |
| Plumbing book rate | 44.5% | If your booking rate is closer to 30%, fix intake before raising budget. | SearchLight |
| Plumbing average ticket | $1,714 | LSA math changes fast by job type; drain, leak, and water heater jobs do not all carry the same margin. | SearchLight |
| Plumbing closed ROAS | 6.85x | A useful ceiling target when revenue match-back is clean. | SearchLight |
| Average LSA book rate, all trades | 43.9% | Plumbing slightly beats the home-services average in this benchmark. | SearchLight |
| Average cost per paying customer | $233 | This is the number owners should compare with gross profit, not only CPL. | SearchLight |
| Average ticket, all trades | $1,826 | Revenue per booked job is what turns a lead channel into a growth channel. | SearchLight |
| Closed ROAS, all trades | 7.84x | Use as a directional benchmark only after call tracking and CRM match-back are reliable. | SearchLight |
2 Lead Rules, Credits, and Screening Benchmarks
Before a plumber treats LSA as a faucet for calls, the account has to pass Google's screening and the team has to understand which leads are charged, credited, and counted against budget.
| Operational benchmark | Value or rule | How to use it | Source |
|---|---|---|---|
| Pricing model | Pay per valid lead | Budget should be planned around calls/messages, not website clicks. | Google Local Services Help |
| Budget unit | Average weekly budget | Set the budget from desired weekly lead volume and service capacity. | Google Local Services Help |
| Monthly max formula | Weekly budget x average weeks/month | Expect week-to-week fluctuation without assuming runaway monthly spend. | Google Local Services Help |
| Lead price variables | Location, job type, lead type, bidding mode | Compare sewer, emergency, and water-heater calls separately. | Google Local Services Help |
| Message lead pricing | Typically lower than phone leads | Do not judge message leads only by CPL; judge by booked jobs. | Google Local Services Help |
| Invalid or low-quality leads | May be not charged at initial contact | Lead quality is screened before some charges ever hit billing. | Google Local Services Help |
| Charged lead reassessment | May receive automated credits later | Reconcile LSA reports against invoices before declaring final CPL. | Google Local Services Help |
| Credit timing | Usually within 30 days | Review a full billing cycle, not only daily lead reports. | Google Local Services Help |
| No-credit categories | Job type not serviced and geo not serviced no longer supported for credits | Set service areas and job types carefully before launch. | Google Local Services Help |
| Verification timeline | 3-4 weeks on average after documents | Do not wait until peak season to start screening. | Google Local Services Help |
| Required checks | Licenses, insurance, and background checks as applicable | Have owner, field, and entity documentation ready before launch. | Google Local Services Help |
| Plumbing vertical screening | Additional background screening | Plumbing is not a lightweight approval category. | Google Local Services Help |
For a plumbing owner, the action item is simple: keep a weekly LSA quality log. Track charged calls, credited calls, missed calls, booked calls, dispatches, revenue, and the reason every unbooked call failed. That turns Google's lead report into a management tool instead of just another ad invoice.
3 Reviews and Trust Benchmarks That Affect LSA Conversion
LSA listings are compressed trust decisions: business name, badge, rating, reviews, location, hours, and response options. Review quality therefore changes paid lead economics even when the LSA bid is unchanged.
| Review benchmark | Value | LSA implication | Source |
|---|---|---|---|
| Consumers who read reviews for local businesses | 97% | Your LSA profile is competing on reputation before the call. | BrightLocal |
| Consumers who always read reviews | 41% | A weak profile loses buyers even with top placement. | BrightLocal |
| Consumers using an average number of review sites | 6 sites | Google reviews matter, but they are not the only trust layer. | BrightLocal |
| Google review-source use | 71% | Google remains the leading source for local recommendations. | BrightLocal |
| ChatGPT/generative AI local recommendation use | 45% | LSA, GBP, website, and review signals increasingly feed broader discovery behavior. | BrightLocal |
| Consumers who will not use a business with fewer than 20 reviews | 47% | A low-count plumber can pay for visibility and still lose the call. | BrightLocal |
| Consumers who only consider reviews from the last three months | 74% | Review recency should be a monthly operating rhythm. | BrightLocal |
| Consumers who care about star ratings | 92% | Star rating is not vanity; it changes contact probability. | BrightLocal |
| Consumers who require 4.5+ stars | 31% | A plumber below 4.5 may need reputation repair before aggressive LSA scaling. | BrightLocal |
| Consumers requiring 4+ stars | 68% | Below 4.0 is a conversion problem, not only an SEO problem. | BrightLocal |
4 LSA vs Google Ads vs Organic Local SEO
LSA is strongest when the homeowner is ready to call. Google Ads is more flexible for landing pages, offers, and service-area coverage. Organic local SEO compounds trust, map visibility, service-page relevance, and branded demand. The mistake is treating them as substitutes.
| Channel benchmark | Value | Meaning for plumbers | Source |
|---|---|---|---|
| 2026 search advertising average CPC | $5.42 | Traditional Google Ads still charges before call quality is known. | LocaliQ |
| Home and home improvement CPC | $8.33 | Home-service clicks are meaningfully above the all-industry CPC average. | LocaliQ |
| 2026 search advertising average CTR | 6.64% | Click-through rate is useful, but LSA owners should still optimize booked calls. | LocaliQ |
| Searches for local businesses resulting in call or visit | 88% | Local intent is high; plumbers need answer speed and proof at every touchpoint. | LocaliQ |
| 2025 Google Ads CTR average | 6.66% | A useful benchmark when comparing paid-search campaigns to LSA lead volume. | WordStream |
| 2025 Home & Home Improvement CTR | 6.37% | Home-service paid search performance sits near the overall average. | WordStream |
| 2025 Google Ads CPC average | $5.26 | Click costs rose for most industries in WordStream's dataset. | WordStream |
| Google Ads cost increase breadth | 87% of industries | Paid media inflation makes SEO and review compounding more important. | WordStream |
| LSA vs blended Google Ads CPL | 49% lower | LSA can be cheaper at lead level, but still needs revenue match-back. | SearchLight |
| LSA vs non-branded Google Ads CPL | 64% lower | Use non-brand campaigns carefully in expensive markets. | SearchLight |
| LSA average ticket vs Google Ads | 26% lower | Cheaper leads can still carry smaller job values. | SearchLight |
| LSA cost per paying customer vs non-brand Google Ads | 71% lower | When booked and tracked well, LSA can be efficient for urgent demand. | SearchLight |
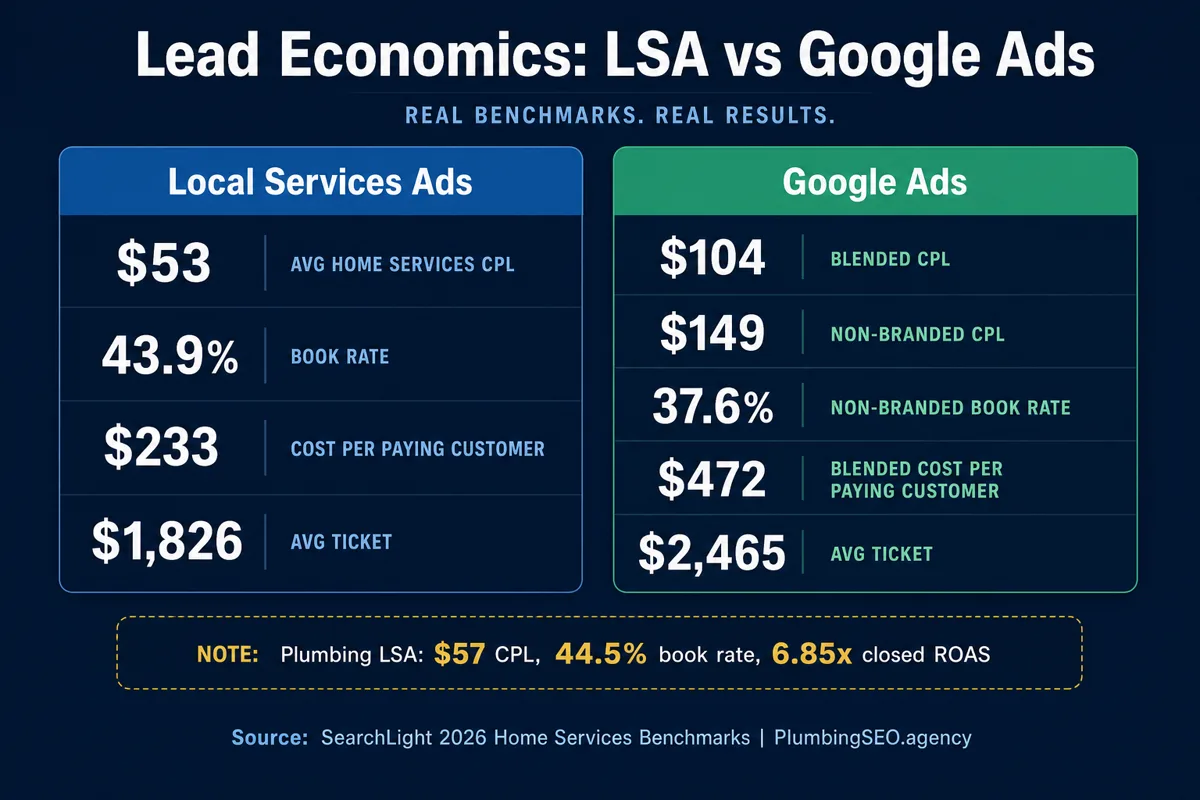
The practical allocation: keep LSAs live for urgent, high-intent calls; use Google Ads where landing-page control and service-line segmentation matter; and build plumbing SEO plus local SEO proof so you are not renting every call forever.
5 77+ Benchmark Inventory for Plumber LSA Planning
Use this inventory as a planning worksheet. The earlier tables cover the core cost, booking, screening, review, and paid-search benchmarks; the rows below add trade comparisons, margin guardrails, and operating checks that make the 77+ benchmark promise practical.
| # | Benchmark or rule | Value | Source |
|---|---|---|---|
| 49 | Electrical LSA CPL | $39 | SearchLight |
| 50 | Electrical book rate | 43.4% | SearchLight |
| 51 | Electrical average ticket | $1,434 | SearchLight |
| 52 | Electrical closed ROAS | 8.52x | SearchLight |
| 53 | HVAC LSA CPL | $51 | SearchLight |
| 54 | HVAC average ticket | $2,110 | SearchLight |
| 55 | HVAC closed ROAS | 9.55x | SearchLight |
| 56 | General/all-trades LSA CPL | $54 | SearchLight |
| 57 | General/all-trades account count | 464 accounts | SearchLight |
| 58 | General/all-trades spend share | 37.3% | SearchLight |
| 59 | General/all-trades spend | $2.51M | SearchLight |
| 60 | Drain/sewer LSA CPL | $59 | SearchLight |
| 61 | Drain/sewer book rate | 39.5% | SearchLight |
| 62 | Drain/sewer average ticket | $1,521 | SearchLight |
| 63 | Drain/sewer closed ROAS | 5.50x | SearchLight |
| 64 | High-performing scenario CPL | $55 | SearchLight |
| 65 | High-performing scenario book rate | 48% | SearchLight |
| 66 | High-performing scenario average ticket | $2,800 | SearchLight |
| 67 | High-performing scenario match rate | 45% | SearchLight |
| 68 | High-performing scenario cost per paying customer | $180 | SearchLight |
| 69 | High-performing scenario ROAS | 15.6x | SearchLight |
| 70 | Low-performing scenario book rate | 30% | SearchLight |
| 71 | Low-performing scenario average ticket | $1,200 | SearchLight |
| 72 | Low-performing scenario match rate | 25% | SearchLight |
| 73 | Low-performing scenario cost per paying customer | $440 | SearchLight |
| 74 | Low-performing scenario ROAS | 2.7x | SearchLight |
| 75 | Illustrative first-job margin | 25% EBITDA | SearchLight |
| 76 | Profit on a $1,800 job at 25% margin | $450 | SearchLight |
| 77 | Estimated breakeven CPL in the example | About $85 | SearchLight |
| 78 | Smaller-market CPL example | $30 CPLs can occur | SearchLight |
| 79 | Competitive-metro CPL example | $90+ CPLs can occur | SearchLight |
| 80 | Third-party plumber LSA range cited by ResultCalls | $20-$100+ per lead | ResultCalls |
| 81 | Third-party LSA conversion lift claim | 10-15% higher | ResultCalls |
| 82 | Home-services mobile search share noted in plumber LSA guidance | Over 70% | RankMeTop |
| 83 | LSA profile ranking factors to audit | Proximity, reviews, responsiveness, hours, completeness | RankMeTop |
6 How to Benchmark Your Own Plumber LSA Account
Start with a rolling 30-day view and compare like with like: phone leads against phone leads, message leads against message leads, and drain or sewer work against the same service line. A blended account average can hide a profitable high-ticket category or a low-quality lead source.
| Metric | Formula | Why it matters |
|---|---|---|
| Net cost per lead | (Spend - credits) / valid leads | Prevents pending credits from overstating final CPL. |
| Booking rate | Booked appointments / valid leads | Shows whether answer speed and call handling convert demand. |
| Cost per booked appointment | Net spend / booked appointments | Connects media cost to dispatchable work. |
| Cost per paying customer | Net spend / completed paid jobs | Removes cancellations, duplicates, and unqualified bookings. |
| Closed ROAS | Matched closed revenue / net spend | Measures revenue actually tied back to LSA leads. |
If CPL is above $57 but cost per paying customer and closed ROAS are healthy, the account may still be working. If CPL is near $57 but booking is well below 44.5%, audit answer speed, intake scripts, service categories, and missed calls before increasing budget. Use call tracking and revenue attribution to verify the handoff, then compare the result with the site's plumber Google Ads benchmarks.
Methodology and Sources
This article combines Google Local Services Ads documentation with current third-party advertising benchmarks. Plumbing-specific numbers are prioritized when available; broader home-services and search advertising numbers are labeled as directional context. Every dollar figure should be compared with your own market, call answer rate, booked-job rate, average ticket, and close rate.
- SearchLight Home Services LSA Benchmark, February 2026
- Google Local Services Help: how leads work
- Google Local Services Help: automated lead credits
- Google Local Services Help: screening and verification requirements
- BrightLocal Local Consumer Review Survey 2026
- LocaliQ Search Advertising Benchmarks 2026
- WordStream Google Ads Benchmarks 2025
- RankMeTop plumber Local Services Ads guide
- ResultCalls plumber Local Services Ads guide
Local Services Ads Statistics FAQ for Plumbers
SearchLight's February 2026 benchmark shows plumbing Local Services Ads averaging $57 per lead, with a 44.5% book rate and 6.85x closed ROAS. Competitive metros can run higher, so the better test is whether cost per paying customer stays below your gross profit per job.
They solve different problems. LSAs are strong for high-intent calls and can be cheaper per lead, while Google Ads gives more landing-page and keyword control. A plumbing company should compare booked jobs, average ticket, revenue match rate, and cost per paying customer across both channels.
Google says screening and verification takes 3-4 weeks on average after documents are submitted. Plumbing professionals may need license, insurance, and background screening, so owners should start the process before seasonal demand peaks.
Google says invalid or low-quality leads may be not charged at initial contact, and charged leads can be reassessed for automated credits. Credits are usually applied within 30 days, but Google no longer supports credits for job-type-not-serviced or geo-not-serviced leads, so setup accuracy matters.
No. LSAs can buy urgent visibility, but SEO, reviews, service pages, and Google Business Profile optimization improve trust and reduce dependence on rented leads. The best setup blends LSAs for immediate demand with local SEO assets that compound over time.
Track valid leads, credits, call answer rate, booking rate, completed paid jobs, average ticket, cost per paying customer, matched revenue, and closed ROAS. Cost per lead can look healthy while missed calls, cancellations, or low-value jobs make the channel unprofitable.
Want to Know Whether Your LSA Calls Are Profitable?
We can audit your Google Business Profile, review profile, service pages, call tracking, and paid lead handoff so you can see where calls are leaking before you raise ad spend.
Request a Plumbing Growth ReviewNo pressure. Just a practical readout of where paid and organic calls are leaking.