
- Smartphone ownership is widespread: 91% of U.S. adults own a smartphone, and 16% are smartphone-only internet users.
- The website is part of the service: 96% of surveyed homeowners expect a user-friendly, professional website.
- Mobile performance remains uneven: 62% of mobile pages in the 2025 Web Almanac achieved good Largest Contentful Paint.
- The call path deserves measurement: Invoca found 46% of home-services phone leads converted during the call, but that benchmark includes several trades and should not be treated as a plumbing-only guarantee.
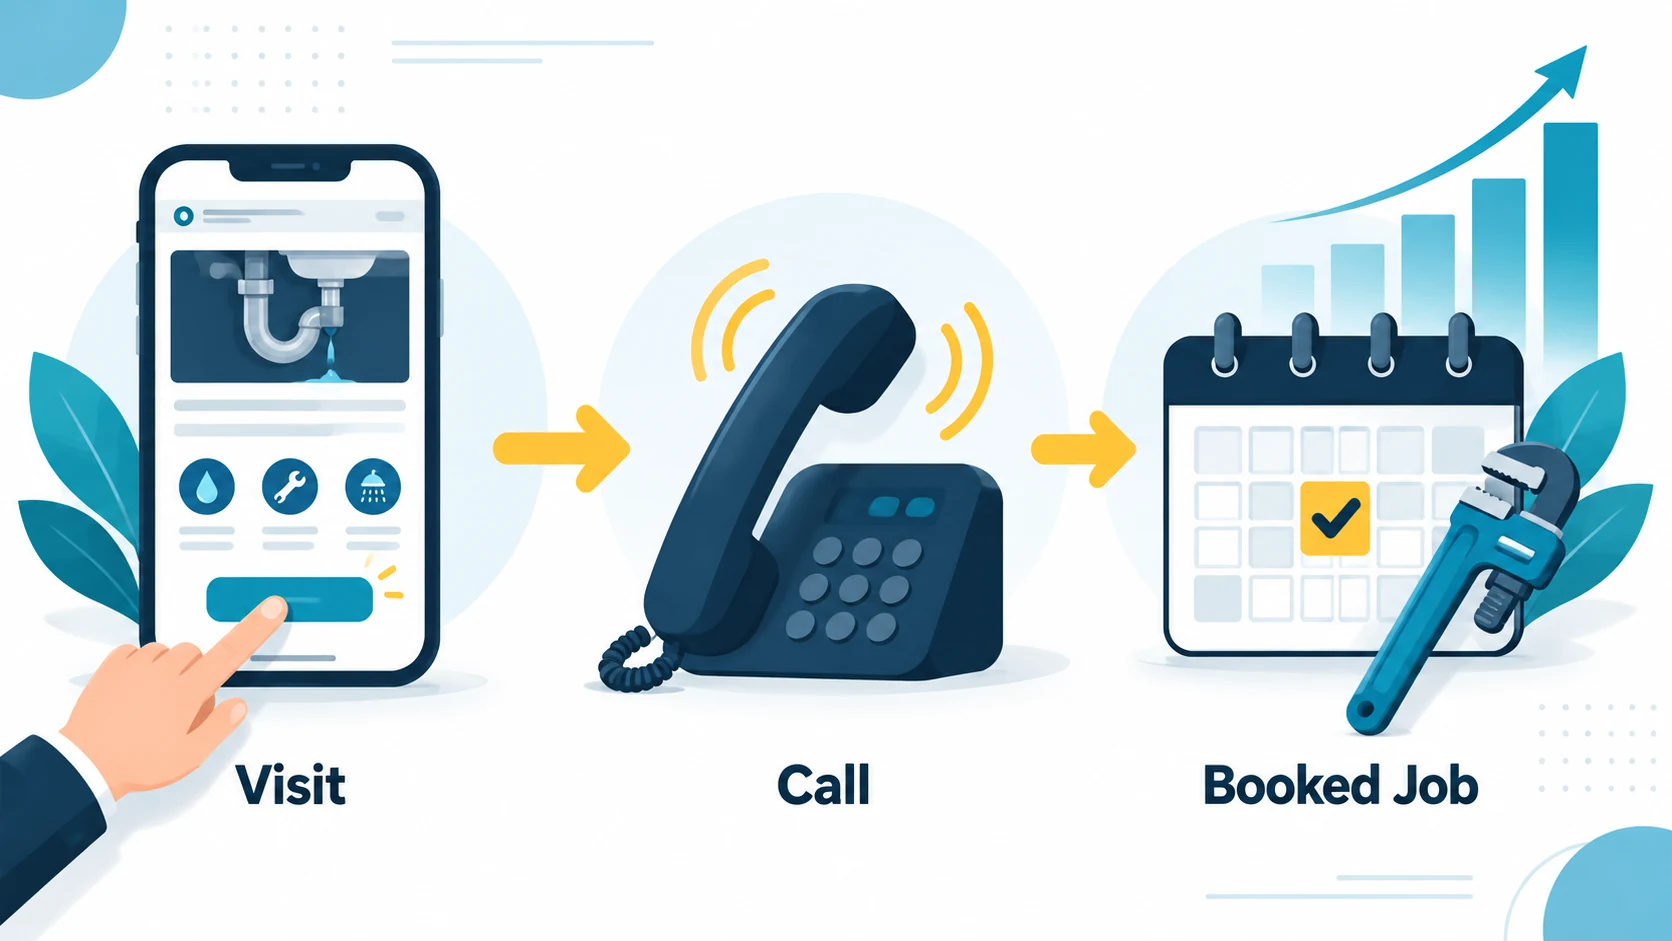
A plumbing website is not a brochure. In an emergency, it is the short path between a leaking pipe and a phone call. For planned work, it is where a homeowner decides whether your company looks legitimate, serves the right location, can handle the job, and makes the next step easy.
This guide brings together 76 numbered benchmarks, plus supporting context from 15+ source records, to help plumbing companies audit that path. The data covers mobile use, homeowner expectations, website speed, Core Web Vitals, accessibility, calls, and paid-search conversion. Where plumbing-only data exists, it is labeled. Where it does not, the table says whether a figure covers home services, U.S. adults, or the web at large.
How to read plumbing website benchmarks without fooling yourself
There is no credible universal “average plumbing website conversion rate.” One company counts a tap-to-call as a conversion. Another counts only booked jobs. Emergency traffic behaves differently from water-heater replacement research. Paid traffic, organic traffic, branded searches, and Google Business Profile visitors also arrive with different intent.
The most useful scorecard follows the whole leak path: impressions, clicks, engaged visits, call or form starts, qualified leads, answered calls, booked jobs, completed revenue, and cost per booked job. Our guide to plumbing website forms versus click-to-call explains why channel definitions matter.
1. Mobile use and homeowner website expectations
Pew's 2025 data documents broad smartphone ownership and a meaningful share of adults without home broadband. Housecall Pro's homeowner survey documents expectations after the click. A professional site, easy booking, clear estimates, proof of work, and communication are separate signals that can help a homeowner assess whether a company appears organized enough to handle the job.
| # | Benchmark | Value | Source | Scope |
|---|---|---|---|---|
| 1 | U.S. adults who own any cellphone | 98% | Pew, 2025 | U.S. adults |
| 2 | U.S. adults who own a smartphone | 91% | Pew, 2025 | U.S. adults |
| 3 | Smartphone ownership in Pew's first ownership survey | 35% | Pew, 2011 | Historical U.S. baseline |
| 4 | Adults who are smartphone-only internet users | 16% | Pew, 2025 | No home broadband |
| 5 | Homeowner decision-makers in the Housecall Pro survey | 1,040 | Housecall Pro, 2025 | U.S. homeowners |
| 6 | Homeowners willing to pay more for a better service reputation | Over 70% | Housecall Pro, 2025 | Survey intention |
| 7 | Homeowners who would refer a pro after an excellent experience | 73% | Housecall Pro, 2025 | Survey intention |
| 8 | Homeowners factoring online booking into provider choice | 80% | Housecall Pro, 2025 | U.S. homeowners |
| 9 | Homeowners expecting a user-friendly professional website | 96% | Housecall Pro, 2025 | U.S. homeowners |
| 10 | Millennials' relative likelihood versus boomers to rehire based on ease | Over 3× | Housecall Pro, 2025 | Generational comparison |
| 11 | Homeowners who appreciate a technician name and photo before arrival | Nearly 60% | Housecall Pro, 2025 | U.S. homeowners |
| 12 | Homeowners comfortable with AI handling initial inquiries | 53% | Housecall Pro, 2025 | Initial inquiries only |
| 13 | Homeowners expecting photo or video proof after work | 68% | Housecall Pro, 2025 | U.S. homeowners |
| 14 | Homeowners saying visual work proof would be nice to receive | 28% | Housecall Pro, 2025 | Separate response group |
| 15 | Homeowners saying they would hire the same company again | 68% | Housecall Pro, 2025 | Survey intention |
| 16 | Homeowners influenced by visuals of past work | 92% | Housecall Pro, 2025 | Reported source graphic |
| 17 | Homeowners saying instant estimates influence hiring | 93% | Housecall Pro, 2025 | Reported source graphic |
| 18 | Homeowners frustrated by hidden costs | 77% | Housecall Pro, 2025 | Reported source graphic |
| 19 | Homeowners expecting payment plans or financing options | 55% | Housecall Pro, 2025 | Reported source graphic |
| 20 | Homeowners who value useful tips from technicians | 70% | Housecall Pro, 2025 | Reported source graphic |
What to do: make the first mobile screen answer five questions quickly: who you are, what service you provide, where you work, why you are trustworthy, and how to call or book. Add real job photos, financing language where appropriate, and expectation-setting. Our plumbing website trust signals guide shows how to place that proof without turning the page into a badge wall.
2. Website speed and Core Web Vitals statistics
The 2025 Web Almanac shows improvement in mobile Core Web Vitals, but it also shows persistent gaps between mobile and desktop. For a plumbing company, that matters because a fast office connection and a desktop PageSpeed screenshot do not represent the homeowner standing near a failed water heater on a cellular network.
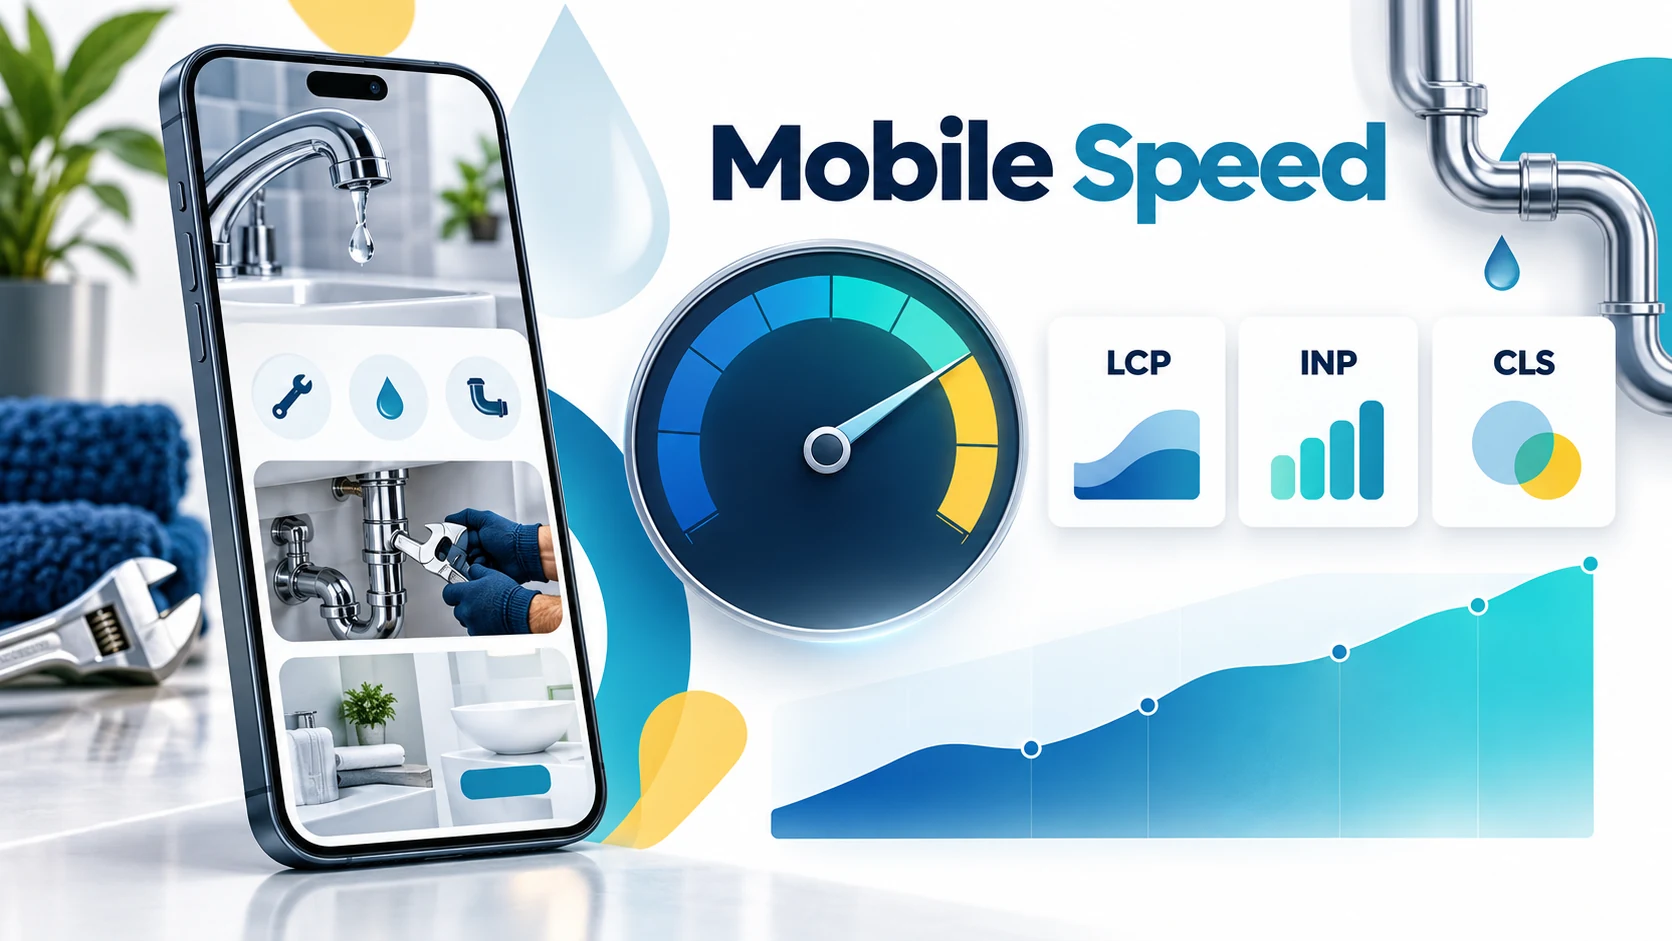
Google's current Core Web Vitals guidance evaluates good performance at the 75th percentile: LCP within 2.5 seconds, INP at or below 200 milliseconds, and CLS at or below 0.1. Test field data first, then use lab tools to diagnose. For implementation details, see our plumber website speed guide and Core Web Vitals guide for plumbers.
| # | Performance benchmark | Value | Source | What it means |
|---|---|---|---|---|
| 21 | Mobile sites with good Core Web Vitals in 2025 | 48% | HTTP Archive, 2026 | Web-wide, not plumbing-only |
| 22 | Mobile sites with good Core Web Vitals in 2023 | 36% | HTTP Archive, 2026 | Historical comparison |
| 23 | Mobile sites with good Core Web Vitals in 2024 | 44% | HTTP Archive, 2026 | Historical comparison |
| 24 | Desktop sites with good Core Web Vitals in 2025 | 56% | HTTP Archive, 2026 | Web-wide |
| 25 | Top 1,000 mobile sites with good Core Web Vitals | 51% | HTTP Archive, 2026 | Popularity cohort |
| 26 | Next 10,000 mobile sites with good Core Web Vitals | 42% | HTTP Archive, 2026 | Popularity cohort |
| 27 | Next 100,000 mobile sites with good Core Web Vitals | 37% | HTTP Archive, 2026 | Popularity cohort |
| 28 | Next 1 million mobile sites with good Core Web Vitals | 42% | HTTP Archive, 2026 | Popularity cohort |
| 29 | Next 10 million mobile sites with good Core Web Vitals | 48% | HTTP Archive, 2026 | Popularity cohort |
| 30 | Good First Contentful Paint threshold | Under 1.8s | HTTP Archive, 2026 | When first content appears |
| 31 | Good Largest Contentful Paint threshold | Within 2.5s | Google web.dev, published 2020; updated 2024 | Assess at 75th percentile |
| 32 | Desktop pages achieving good LCP | 74% | HTTP Archive, 2026 | Web-wide |
| 33 | Mobile pages achieving good LCP | 62% | HTTP Archive, 2026 | Web-wide |
| 34 | Poor LCP experiences on mobile versus desktop | 13% vs. 7% | HTTP Archive, 2026 | Mobile is nearly double |
| 35 | Desktop pages whose LCP element is an image | 85.3% | HTTP Archive, 2026 | Hero images often control LCP |
| 36 | Mobile pages whose LCP element is an image | 76% | HTTP Archive, 2026 | Hero optimization matters |
| 37 | LCP images using JPEG | 57% | HTTP Archive, 2026 | Legacy format remains dominant |
| 38 | LCP images using PNG | 26% | HTTP Archive, 2026 | Often heavier than modern formats |
| 39 | Mobile pages using fetchpriority="high" on LCP images | 17% | HTTP Archive, 2026 | Low adoption |
| 40 | Pages preloading LCP images | 2.1–2.2% | HTTP Archive, 2026 | Very low adoption |
| 41 | Pages lazy-loading their LCP image | 16–17% | HTTP Archive, 2026 | Usually delays primary content |
| 42 | Mobile websites achieving good INP | 77% | HTTP Archive, 2026 | Field responsiveness |
| 43 | Desktop websites achieving good INP | 97% | HTTP Archive, 2026 | Field responsiveness |
| 44 | Median mobile Total Blocking Time | 1,916ms | HTTP Archive, 2026 | Lab proxy, not field INP |
| 45 | Median desktop Total Blocking Time | 92ms | HTTP Archive, 2026 | Large device gap |
| 46 | 90th-percentile mobile Total Blocking Time | Over 7.5s | HTTP Archive, 2026 | Heavy-script warning |
| 47 | Mobile pages achieving good CLS | 81% | HTTP Archive, 2026 | Web-wide |
| 48 | Mobile pages missing dimensions on at least one image | 62% | HTTP Archive, 2026 | Potential layout-shift risk |
| 49 | Desktop pages missing dimensions on at least one image | 65% | HTTP Archive, 2026 | Potential layout-shift risk |
| 50 | Mobile pages using at least one web font | 87% | HTTP Archive, 2026 | Fonts need disciplined loading |
| 51 | Mobile pages with non-composited animations | 40% | HTTP Archive, 2026 | Potential performance risk |
What to do: compress and correctly size the hero image, use WebP or AVIF where practical, include width and height attributes, and do not lazy-load the likely LCP element. Remove scripts that do not help calls or measurement. Make the sticky phone CTA responsive immediately. Historical Think with Google research also found bounced mobile sessions had DOM-ready times 55% slower and converted sessions used 38% fewer images, a useful reminder that every visual and widget must earn its place.
3. Accessibility and form usability statistics
Accessibility is conversion hygiene. A missing form label, weak contrast, empty button, or unclear link can stop a visitor from requesting service. WebAIM's automated 2026 analysis found detectable failures on most home pages, but automated scans catch only some accessibility issues. A clean scanner result is not a compliance certificate.
| # | Accessibility benchmark | Value | Source | Caveat |
|---|---|---|---|---|
| 52 | Home pages with detected WCAG failures | 95.9% | WebAIM, 2026 | Automated detection only |
| 53 | Average detected accessibility errors per page | 56.1 | WebAIM, 2026 | One million home pages |
| 54 | Year-over-year increase in detected errors | 10.1% | WebAIM, 2026 | Compared with 2025 |
| 55 | Pages without detected WCAG failures | 4.1% | WebAIM, 2026 | Not proof of full compliance |
| 56 | Average page elements per detected error | About 26 | WebAIM, 2026 | Automated findings |
| 57 | Share of page elements with a detected accessibility error | 3.9% | WebAIM, 2026 | Element-level measure |
| 58 | Pages with low-contrast text | 83.9% | WebAIM, 2026 | At least one detected instance |
| 59 | Pages with missing image alternative text | 53.1% | WebAIM, 2026 | At least one instance |
| 60 | Pages with missing form input labels | 51% | WebAIM, 2026 | Direct form usability risk |
| 61 | Pages with empty links | 46.3% | WebAIM, 2026 | At least one instance |
| 62 | Pages with empty buttons | 30.6% | WebAIM, 2026 | At least one instance |
| 63 | Pages missing a document language | 13.5% | WebAIM, 2026 | At least one instance |
| 64 | Pages using ARIA | 82.7% | WebAIM, 2026 | ARIA use is not compliance |
| 65 | Average detected errors on pages with ARIA versus without ARIA | 59.1 vs. 42 | WebAIM, 2026 | Correlation, not causation |
What to do: give every form control a visible label, every icon-only button an accessible name, every useful image accurate alternative text, and every decorative image empty alt text. Keep phone links descriptive, preserve focus indicators, and test the call and form path with a keyboard. Use automation as the first pass, then complete manual mobile, keyboard, zoom, and screen-reader checks.
4. Call and conversion benchmarks
The website does not finish the sale; it hands the lead to the phone team. Invoca's 2025 analysis of more than 60 million calls found large gaps between reaching a person, qualifying as a lead, receiving an ask to book, and converting. The 46% home-services figure is valuable context, but it includes multiple trades and measures phone leads converting during the call—not all website visits.
| # | Call benchmark | Value | Source | Scope |
|---|---|---|---|---|
| 66 | Home-services phone leads converting during the call | 46% | Invoca, 2025 | Multiple home-service trades |
| 67 | Phone leads converting during the call across industries | 37% | Invoca, 2025 | Multiple industries |
| 68 | Callers who speak with a person | 61% | Invoca, 2025 | Multiple industries |
| 69 | Calls from digital marketing that are qualified leads | 35% | Invoca, 2025 | Multiple industries |
| 70 | Range in call answer rates across industries | 54–69% | Invoca, 2025 | Industry range |
| 71 | Phone calls rated “excellent” by contact-center managers | 28% | Invoca, 2025 | Manager quality rating |
| 72 | Agents who ask leads to buy or book | 35% | Invoca, 2025 | Observed call behavior |
ServiceTitan's older but useful 2022 platform analysis provides another operational reference: the typical shop booked 42% of calls across more than 3,000 trade businesses. It also estimated that a five-point booking improvement for businesses with 5–14 technicians could correspond to about $100,000 in additional revenue. Treat that as a dated platform-specific example, not a guaranteed outcome for your company.
What to do: track calls by source, answer rate, qualified-lead rate, booking rate, and booked revenue. Review missed calls and calls where the customer never received a clear scheduling ask. A website redesign cannot repair a dispatch process that leaves the phone unanswered. See our broader plumbing lead generation statistics for cross-channel benchmarks.
5. Plumbing paid-search landing-page benchmarks
LocaliQ analyzed more than 3,200 home-services search campaigns running from April 2024 through March 2025. Its plumbing row provides a rare trade-specific comparison. These numbers are useful for paid landing pages, but the configured conversion may be a call, form, or another action. Do not compare the 7.63% figure directly with booked-job rate or with all-site organic conversion.
| # | Plumbing paid-search benchmark | Value | Source | Use |
|---|---|---|---|---|
| 73 | Conversion rate | 7.63% | LocaliQ, 2025 | Compare matched paid campaigns |
| 74 | Click-through rate | 4.97% | LocaliQ, 2025 | Search ads only |
| 75 | Cost per click | $10.49 | LocaliQ, 2025 | Campaign benchmark |
| 76 | Cost per lead | $129.02 | LocaliQ, 2025 | Campaign benchmark |
For context, LocaliQ reported a 7.33% average conversion rate, $7.85 average CPC, and $90.92 average cost per lead across home services. Plumbing's higher CPC and CPL reinforce why landing-page clarity and call handling matter: each lost qualified click is expensive. For a stronger measurement model, connect ad group, landing page, call recording, qualification, booking, and revenue.
6. Cross-checks from supporting datasets
A benchmark becomes more useful when it survives comparison with datasets built for different purposes. The sources below are not plumbing conversion standards. They provide directional checks on device behavior, booking preference, reviews, landing-page traffic, credibility, and the scale of modern digital-experience research.
| Dataset | Verified findings | Source | How to use it |
|---|---|---|---|
| U.S. platform traffic | In August 2026, Statcounter measured U.S. traffic at 42.26% mobile, 55.59% desktop, and 2.15% tablet. | Statcounter, August 2026 | Dated chart; traffic share, not ownership or plumbing leads |
| U.S. digital adoption | DataReportal reported 417 million active cellular connections, equal to 120% of population, plus 324 million internet users and 93.1% internet penetration at the end of 2025. | DataReportal, 2026 | Connections can exceed people; do not treat them as unique users |
| Online booking | ServiceTitan reported that 70% of consumers expect to book online and 94% of consumers looking for a new contractor are more likely to choose one that offers online booking. | ServiceTitan, 2024 | Consumer preference research, not booked-job guarantees |
| Local reviews | BrightLocal found that 74% care about reviews written within the last three months, 65% wrote a review after being asked, and 89% expect business owners to respond to reviews. | BrightLocal, 2026 | Supports recent review proof and response discipline |
| Landing pages | Unbounce built its 2024 report from more than 41,000 landing pages, 464 million unique visitors, and 57 million conversions; it also reported that some industries receive up to 7× more mobile than desktop visitors. | Unbounce, 2024 | Cross-industry landing pages, not plumbing sites |
| Digital experience | Contentsquare's 2026 benchmarks cover more than 6,500 sites, 99 billion web and mobile sessions, and 22 million customer-service interactions. | Contentsquare, 2026 | Dataset scale and directional UX context |
| Speed outcomes | Google's case-study collection reports that Vodafone improved LCP 31% and saw 8% more sales, iCook improved CLS 15% and saw 10% more ad revenue, and Tokopedia improved LCP 55% with 23% better average session duration. | Google web.dev, 2024 | Company case studies show correlation in context, not universal uplift |
| Mobile speed behavior | Historical Think with Google research found bounced sessions had DOM-ready times 55% slower and converted sessions used 38% fewer images. | Think with Google, 2017 | Historical directional evidence |
| Website credibility | Stanford's 10 credibility guidelines were based on three years of research involving more than 4,500 people. | Stanford, 2002 | Old but foundational; apply principles, not current behavior rates |
The pattern is consistent even though the methods differ: mobile access is substantial, customers expect convenient paths, trust signals matter, and performance must be evaluated alongside the phone and booking workflow. The correct next step is still to compare your own device, service, source, call, and booked-revenue data.
What plumbing companies should fix first
Do not turn 76 benchmarks into a 76-item redesign. Fix the shortest path to a booked job, then improve supporting pages and systems.
1Protect the mobile call path
Put a tappable phone button and clear service/location promise in the first screen. Test on an average phone over cellular, not only desktop Wi-Fi.
2Fix the largest visible element
Compress the hero, use a modern image format, add explicit dimensions, preload or prioritize it when appropriate, and never lazy-load the likely LCP image.
3Remove trust ambiguity
Show real jobs, service areas, business identity, review proof, financing context, warranties, and what happens after the customer calls.
4Make forms usable
Use visible labels, a short set of required fields, clear errors, large controls, a useful confirmation, and a human follow-up plan.
5Measure the phone
Track answer rate, qualified calls, booking asks, booked jobs, and revenue by source. Website conversion alone can hide a dispatch leak.
6Audit pages that win calls
Start with the homepage, emergency plumbing, drain cleaning, sewer repair, water heaters, city pages, and paid landing pages.
If the website needs structural work rather than another plugin, review our plumbing website design service. The goal is not a prettier brochure. It is a fast, crawlable, measurable system that helps local plumbing companies and plumbers turn the right visits into calls and jobs.
Methodology and source notes
This article was updated September 25, 2026. We reviewed primary research, first-party technical guidance, original industry datasets, and a trade-publication report of Invoca's call dataset. The source inventory contains 17 records from 15+ publishers or research programs. Each numbered statistic includes a source, year, and scope. We excluded unsupported “average plumber website conversion” claims and figures that could not be tied to an identifiable source.
- Pew Research Center Mobile Fact Sheet — U.S. adult device ownership and smartphone dependency.
- Housecall Pro 2025 homeowner survey — online survey of 1,040 U.S. homeowner decision-makers.
- HTTP Archive 2025 Web Almanac, Performance — web-wide performance data, published in 2026.
- Google web.dev Web Vitals (published 2020; updated 2024) — metric definitions, thresholds, and 75th-percentile guidance.
- WebAIM Million 2026 — automated accessibility analysis of one million home pages.
- Invoca 2025 benchmarks reported by Supply House Times — analysis of more than 60 million calls.
- LocaliQ 2025 home-services search benchmarks — more than 3,200 campaigns from April 2024 through March 2025.
- ServiceTitan call-booking report — older operational comparison from more than 3,000 trade businesses.
- ServiceTitan online-booking recap — consumer booking-preference survey findings.
- BrightLocal Local Consumer Review Survey 2026 — U.S. review behavior and response expectations.
- Statcounter U.S. platform traffic, August 2026 — measured desktop, mobile, and tablet share.
- Unbounce Conversion Benchmark Report — cross-industry landing-page dataset.
- Contentsquare 2026 Digital Experience Benchmark — cross-industry web, mobile, and conversation dataset.
- DataReportal Digital 2026: United States — national connectivity and internet adoption.
- Stanford Web Credibility Guidelines — foundational credibility research.
Frequently asked questions
There is no universal plumbing website conversion rate because companies define conversions differently. LocaliQ reported a 7.63% conversion rate for plumbing paid-search campaigns in its 2025 dataset, but that should be compared only with similarly defined paid traffic. Track qualified leads and booked jobs by device, page, and source.
Use Google's good Core Web Vitals thresholds at the 75th percentile: LCP within 2.5 seconds, INP at or below 200 milliseconds, and CLS at or below 0.1. Prioritize the pages that win calls and test real mobile field data.
Support both. Emergency visitors often want a fast call, while planned-project visitors may prefer a form or online booking. Make the phone number tappable, keep forms short and labeled, and measure qualified and booked outcomes from each path.
No. Core Web Vitals are part of page experience, not a guarantee of rankings. Relevance, helpful service pages, local signals, links, reviews, technical crawlability, and competition still matter. Speed is valuable because it also reduces friction for real visitors.
No. Automated tools detect only some accessibility issues. Use them to find obvious problems, then complete manual keyboard, zoom, mobile, focus, form, and screen-reader checks with qualified help where needed.
Is your plumbing website leaking calls?
Get a practical review of the pages, speed, trust signals, local visibility, and conversion path that matter most.
Run My Free SEO Leak Check