
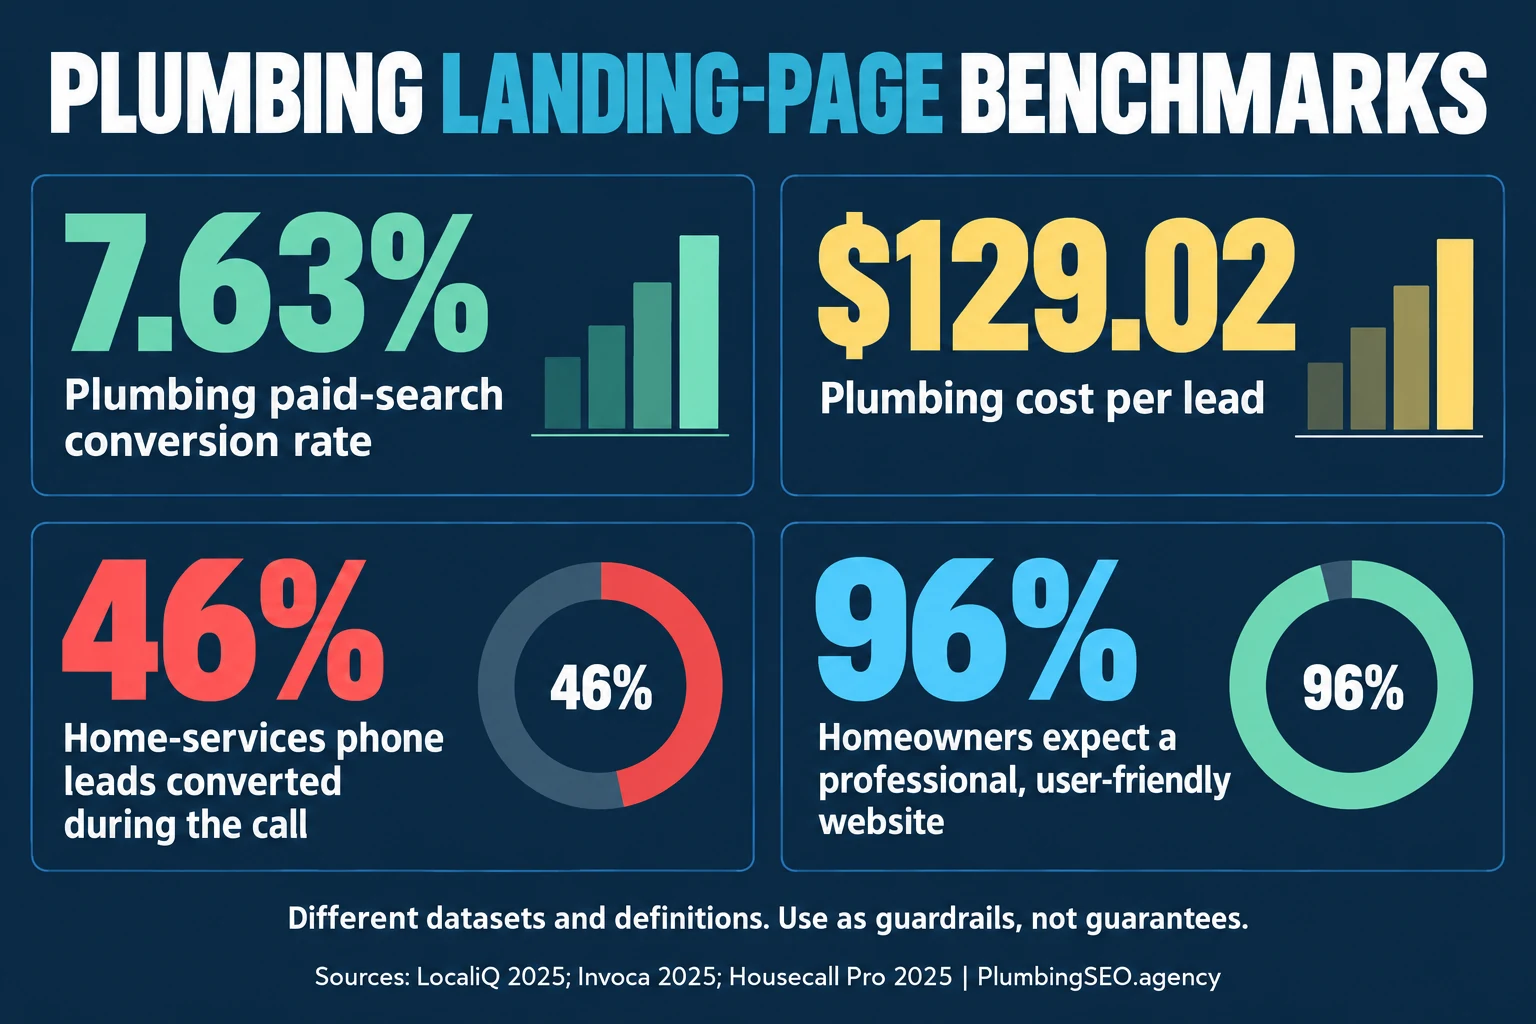
- Plumbing paid-search conversion is a useful starting line, not the finish: LocaliQ measured a 7.63% configured conversion rate and $129.02 cost per lead for plumbing Search campaigns.
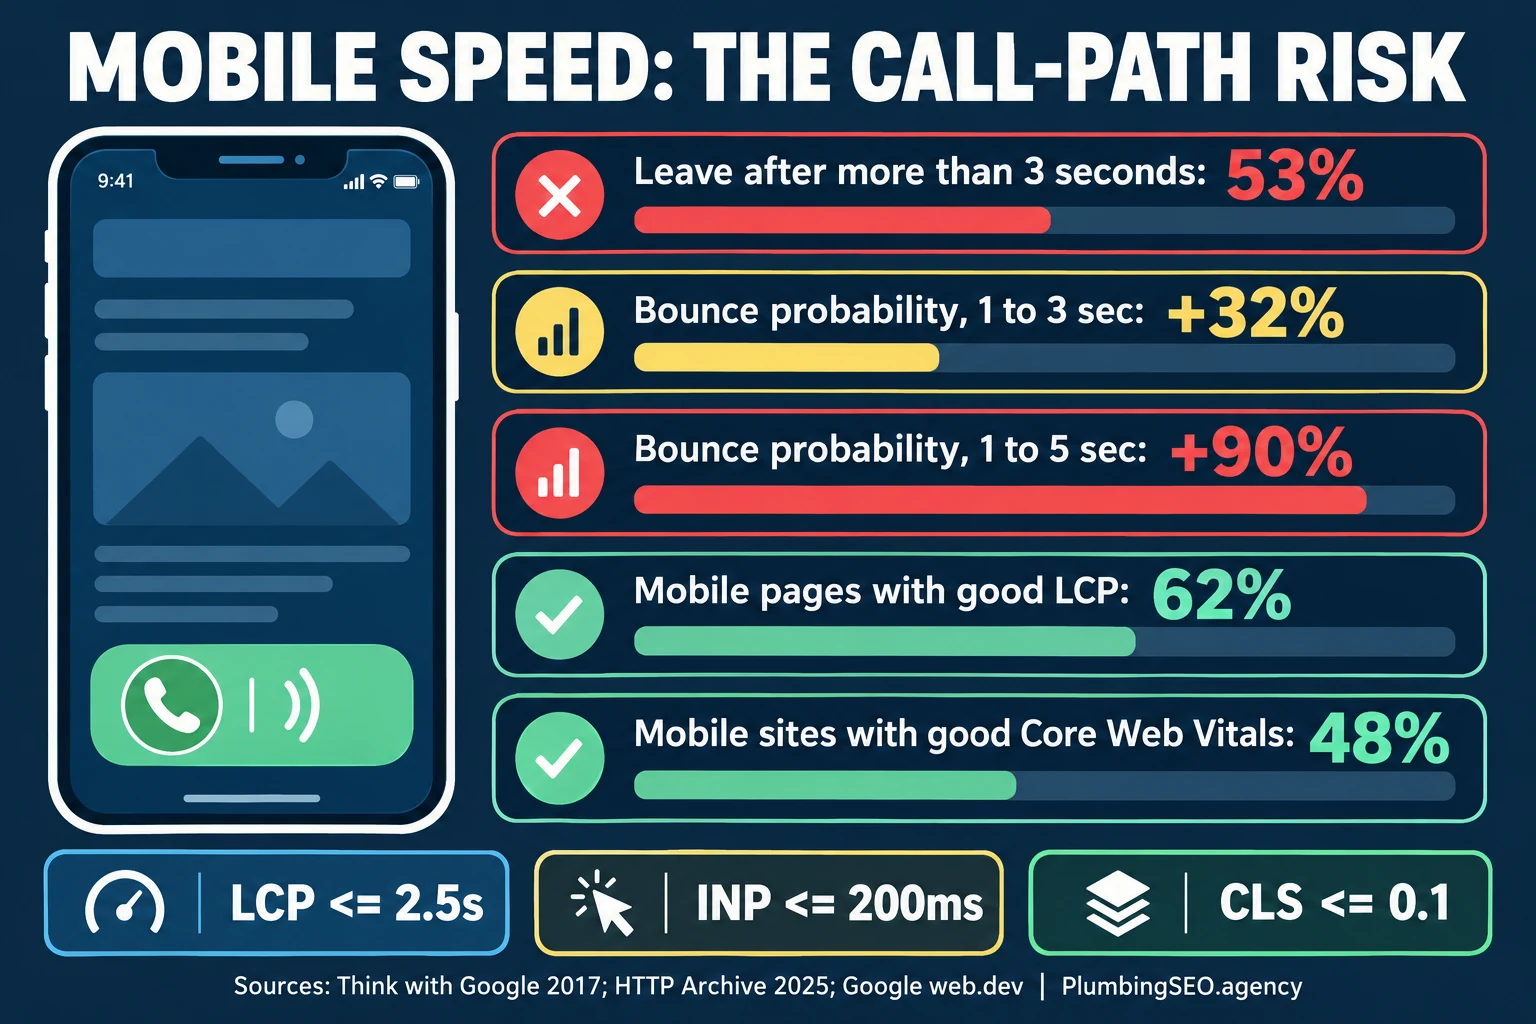
- Mobile friction gets expensive fast: historical Google research found 53% of mobile visitors left when a page took longer than three seconds to load.
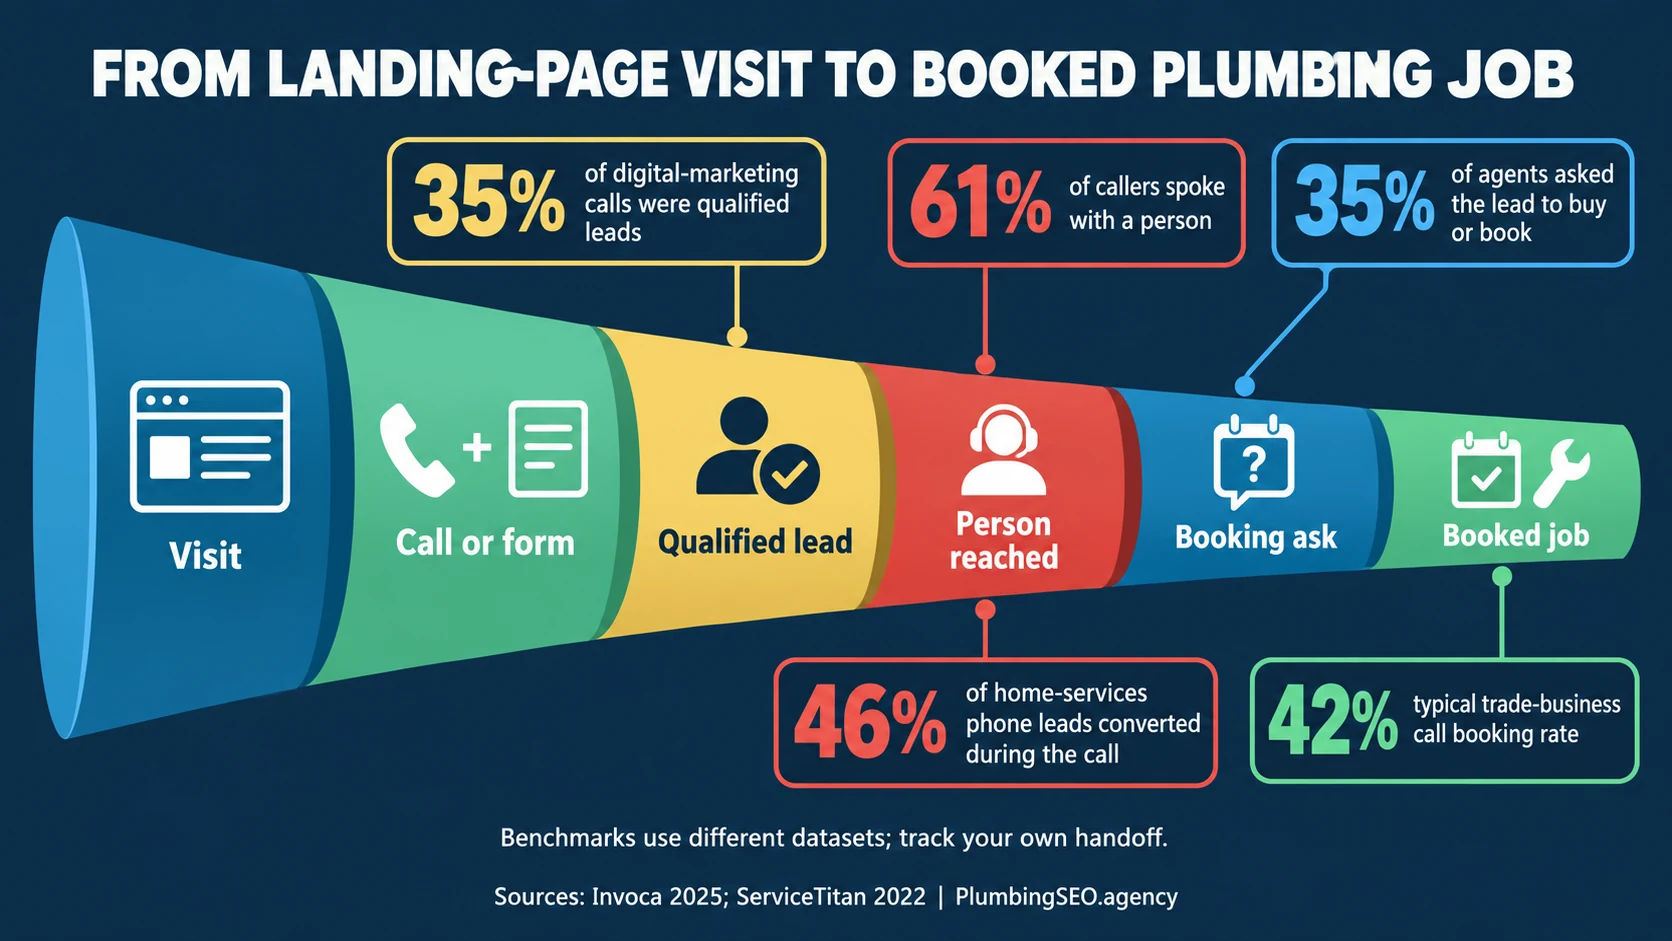
- The page cannot answer the phone: Invoca found that only 61% of callers in its broad dataset reached a person, while 35% of agents asked the lead to buy or book.
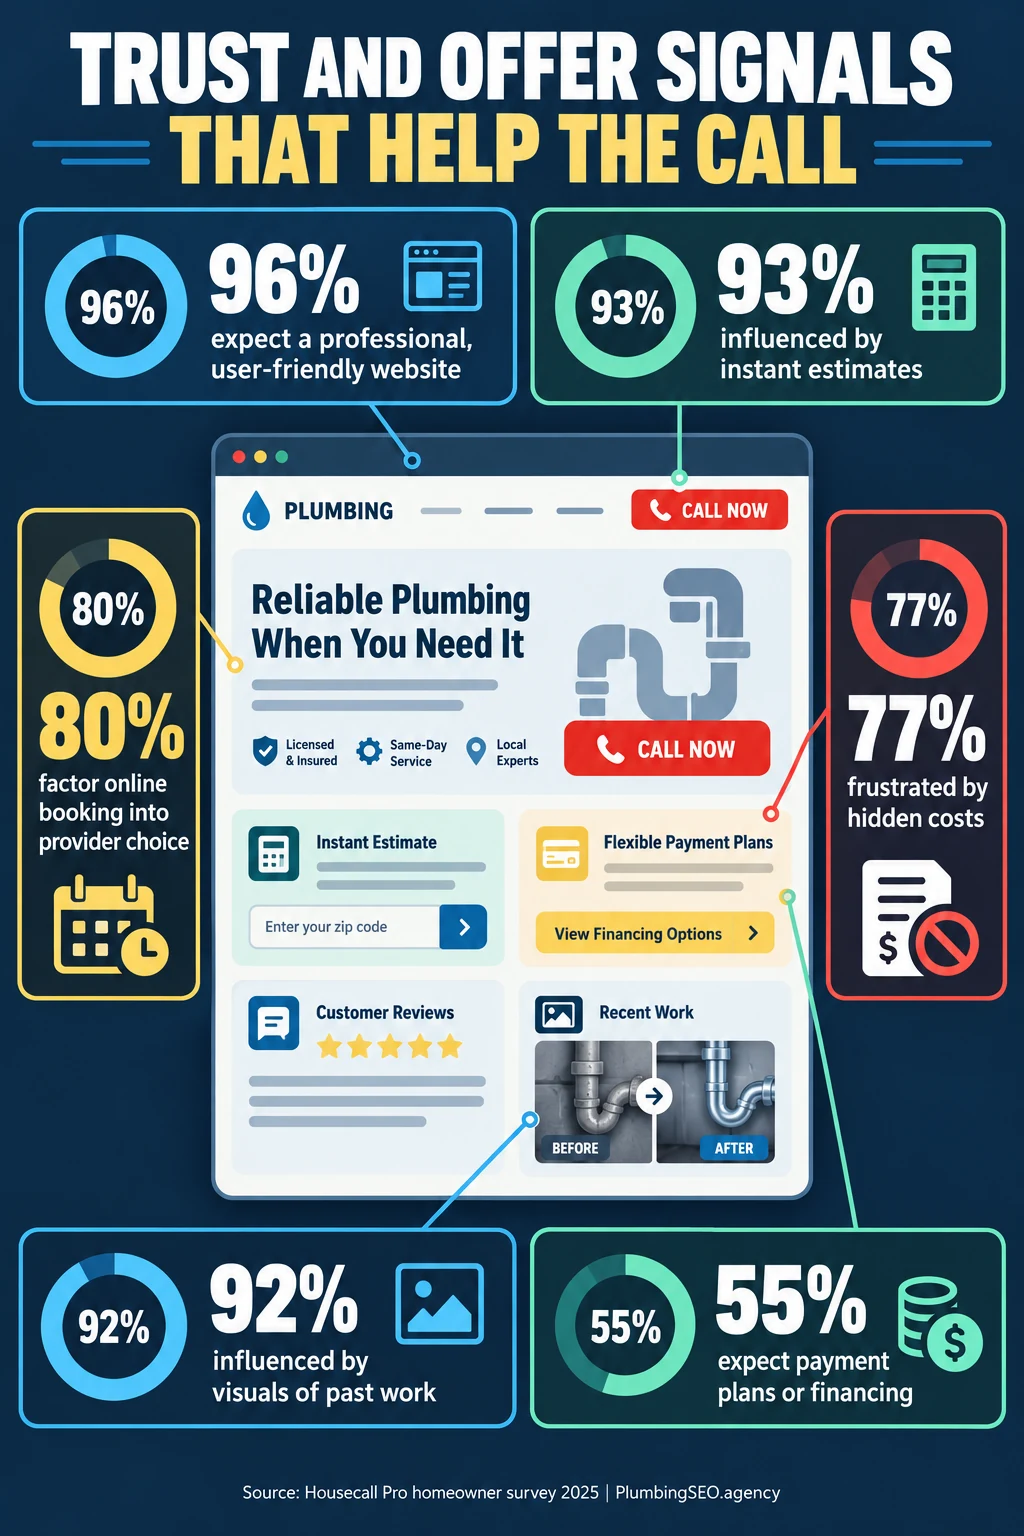
- Trust and the offer belong near the CTA: 96% of surveyed homeowners expected a professional, user-friendly website, 80% factored online booking into provider choice, and 77% were frustrated by hidden costs.
A plumbing landing page is where an expensive click meets a customer who may have water on the floor, a cold shower, or a planned project large enough to require financing. The page has a narrow job: confirm the service and location, establish trust, and create the shortest honest path to a qualified call or request.
This guide assembles 88 numbered plumbing landing page statistics from trade-specific advertising data, home-service surveys, large web datasets, product documentation, and call analytics. Public plumbing-only landing-page research is limited, so every table keeps its scope attached. A plumbing paid-search conversion is not the same as a home-services phone conversion, and neither is a booked job.
Use the figures to build a baseline, find friction, and design tests. Then compare the page against your own qualified-call rate, booking rate, completed work, revenue, and margin. For the page layout itself, pair these benchmarks with our above-the-fold plumbing PPC guide.
- Use 7.63% as a comparison point only for similarly configured plumbing paid-search campaigns, then replace it with your own qualified and booked-job rates (LocaliQ).
- Protect every click: the same plumbing dataset measured $10.49 CPC and $129.02 CPL, before lead qualification or booking (LocaliQ).
- Keep the mobile first screen lean. Historical Google research found 53% left when load exceeded three seconds (Think with Google).
- Use current field targets: LCP at or below 2.5 seconds, INP at or below 200 milliseconds, and CLS at or below 0.1 at the 75th percentile (Google web.dev).
- Make the local answer immediate. Historical Google research found 76% of nearby smartphone searchers visited a business within a day (Think with Google).
- Design for broad phone access: 91% of U.S. adults own a smartphone, and 16% are smartphone-only internet users (Pew).
- Treat usability as trust. 96% of surveyed homeowners expected a professional, user-friendly website (Housecall Pro).
- Offer a monitored booking option where operations support it; 80% factored online booking into provider choice in the same homeowner survey (Housecall Pro).
- Explain the estimate and fees. 77% of surveyed homeowners were frustrated by hidden costs (Housecall Pro).
- Audit the ring after the click: only 61% of callers reached a person in Invoca's broad dataset (Invoca data).
- Listen for the booking ask. Only 35% of observed agents asked the lead to buy or book in that dataset (Invoca data).
- Do not let a short form become an inaccessible form: 51% of home pages in WebAIM's automated study had missing input labels (WebAIM).
Quick plumbing landing page benchmark summary
Start here if you need a compact scorecard. The scope column is as important as the value because these figures measure different stages and populations.
| Metric | Published benchmark | Best use | Source |
|---|---|---|---|
| Plumbing paid-search conversion rate | 7.63% | Compare similarly configured Search campaigns, not booked-job rate | LocaliQ, 2025 |
| Plumbing paid-search cost per lead | $129.02 | Starting point before qualification and booking | LocaliQ, 2025 |
| Mobile exits after load exceeds three seconds | 53% | Historical warning about slow mobile pages | Think with Google, 2017 |
| Good Largest Contentful Paint | ≤2.5 seconds | Field-performance target at the 75th percentile | Google web.dev |
| Home-services phone leads converting during call | 46% | Call-handling context across multiple trades | Invoca, 2025 |
| Callers who reached a person | 61% | Diagnose answer and routing loss | Invoca, 2025 |
| Typical trade-business call booking | 42% | Dated platform benchmark for phone operations | ServiceTitan, 2022 |
| Homeowners expecting a professional website | 96% | Set the trust and usability bar | Housecall Pro, 2025 |
| Home pages with missing input labels | 51% | Form-accessibility warning, not a plumbing rate | WebAIM, 2026 |
How to measure landing-page conversion without fooling yourself
A page can show a healthy platform conversion rate while producing weak plumbing leads. The problem is usually the denominator, the event definition, or the handoff. One account counts every phone-number tap. Another counts calls over 60 seconds. A third counts booked jobs. Their percentages should not be compared as though they measure the same thing.
If your team is deciding between a short form and a phone-first design, our guide to plumbing forms versus click-to-call explains the tracking tradeoffs.
1. Plumbing paid-search conversion benchmarks
LocaliQ reviewed more than 3,200 home-services Search campaigns that ran from April 2024 through March 2025. Its plumbing row offers a useful trade-specific baseline, while the all-home-services row provides a matched context. A configured conversion may be a call, form, or another action. It is not automatically qualified or booked.
| # | Conversion benchmark | Value | Source | Scope |
|---|---|---|---|---|
| 1 | Plumbing paid-search click-through rate | 4.97% | LocaliQ, 2025 | Plumbing Search campaigns |
| 2 | Plumbing paid-search cost per click | $10.49 | LocaliQ, 2025 | Click cost |
| 3 | Plumbing paid-search conversion rate | 7.63% | LocaliQ, 2025 | Configured conversions |
| 4 | Plumbing paid-search cost per lead | $129.02 | LocaliQ, 2025 | Not cost per booked job |
| 5 | All-home-services click-through rate | 5.59% | LocaliQ, 2025 | Matched home-services dataset |
| 6 | All-home-services cost per click | $7.85 | LocaliQ, 2025 | Matched home-services dataset |
| 7 | All-home-services conversion rate | 7.33% | LocaliQ, 2025 | Configured conversions |
| 8 | All-home-services cost per lead | $90.92 | LocaliQ, 2025 | Matched home-services dataset |
Owner takeaway: plumbing's conversion rate was close to the broader home-services rate, but its CPC and CPL were higher. That makes message match, service-area filtering, click-to-call placement, and phone handling more financially important. Read our broader Google Ads statistics for plumbers for campaign, query, and profit context.
2. Mobile and local-search intent statistics
A landing page should be designed for the device and moment, not a desktop mockup. Pew documents device access; Google's local-search research is older and should be treated as directional. Together, they explain why plumbing pages need visible service-area confirmation and an immediate tap-to-call path.
| # | Mobile or local benchmark | Value | Source | Scope note |
|---|---|---|---|---|
| 9 | Nearby smartphone searchers who visited a business within one day | 76% | Think with Google | Historical local-search research |
| 10 | Nearby smartphone searches that resulted in a purchase | 28% | Think with Google | Not plumbing-only |
| 11 | Smartphone searches related to location | 30% | Think with Google | Historical behavior |
| 12 | U.S. adults owning any cellphone | 98% | Pew, 2025 | U.S. adults |
| 13 | U.S. adults owning a smartphone | 91% | Pew, 2025 | Ownership, not landing-page traffic |
| 14 | Adults who are smartphone-only internet users | 16% | Pew, 2025 | No home broadband |
| 15 | Smartphone ownership in Pew's first ownership survey | 35% | Pew, 2011 | Historical baseline |
Owner takeaway: make the phone number a real tel: link, keep the primary CTA reachable with one thumb, and place city or service-area language near the headline. Emergency traffic should not have to open a menu to learn whether the shop serves the neighborhood.
Device mix still varies. Statcounter's August 2026 U.S. snapshot measured 42.26% mobile, 55.59% desktop, and 2.15% tablet traffic. That is a dated national platform view, not plumbing lead data; segment your own landing-page results by device.
3. Landing-page speed and Core Web Vitals statistics
Speed affects the plumbing call path before the visitor evaluates reviews, warranties, or an offer. Google's older mobile research documents behavior under slower loads. The 2025 Web Almanac gives a newer web-wide view, while Google web.dev defines the current Core Web Vitals thresholds.
| # | Speed benchmark | Value | Source | Interpretation |
|---|---|---|---|---|
| 16 | Mobile visitors leaving when load exceeded three seconds | 53% | Think with Google, 2017 | Historical mobile finding |
| 17 | Modeled bounce-probability increase from one to three seconds | 32% | Think with Google, 2017 | Modeled probability |
| 18 | Modeled bounce-probability increase from one to five seconds | 90% | Think with Google, 2017 | Modeled probability |
| 19 | Slower DOM-ready time in bounced sessions | 55% | Think with Google, 2017 | Historical correlation |
| 20 | Fewer images used in converted sessions | 38% | Think with Google, 2017 | Historical correlation |
| 21 | Mobile sites with good Core Web Vitals in 2025 | 48% | HTTP Archive, 2026 | Web-wide |
| 22 | Desktop sites with good Core Web Vitals in 2025 | 56% | HTTP Archive, 2026 | Web-wide |
| 23 | Mobile pages achieving good Largest Contentful Paint | 62% | HTTP Archive, 2026 | Web-wide |
| 24 | Desktop pages achieving good Largest Contentful Paint | 74% | HTTP Archive, 2026 | Web-wide |
| 25 | Mobile experiences with poor Largest Contentful Paint | 13% | HTTP Archive, 2026 | Web-wide |
| 26 | Desktop experiences with poor Largest Contentful Paint | 7% | HTTP Archive, 2026 | Web-wide |
| 27 | Mobile websites achieving good Interaction to Next Paint | 77% | HTTP Archive, 2026 | Field responsiveness |
| 28 | Desktop websites achieving good Interaction to Next Paint | 97% | HTTP Archive, 2026 | Field responsiveness |
| 29 | Mobile pages achieving good Cumulative Layout Shift | 81% | HTTP Archive, 2026 | Visual stability |
| 30 | Mobile pages missing dimensions on at least one image | 62% | HTTP Archive, 2026 | Layout-shift risk |
| 31 | Mobile pages using at least one web font | 87% | HTTP Archive, 2026 | Font-loading consideration |
| 32 | Mobile pages with non-composited animations | 40% | HTTP Archive, 2026 | Potential rendering cost |
| 33 | Good Largest Contentful Paint threshold | ≤2.5s | Google web.dev | Assess at 75th percentile |
| 34 | Good Interaction to Next Paint threshold | ≤200ms | Google web.dev | Assess at 75th percentile |
| 35 | Good Cumulative Layout Shift threshold | ≤0.1 | Google web.dev | Assess at 75th percentile |
Owner takeaway: optimize the first screen before adding another widget. Compress and correctly size the hero, provide width and height, avoid lazy-loading the likely LCP image, remove scripts that do not create or measure calls, and make the CTA interactive quickly. Our plumber website speed guide turns those priorities into an audit.
4. Call conversion, booking, and handoff statistics
A landing page can only offer the call. The office has to answer, qualify, ask for the booking, and route the job. Invoca's 2025 analysis covered more than 60 million calls; its home-services result spans multiple trades. ServiceTitan's 2022 figures are older and platform-specific, but they show why booking belongs in a landing-page report.
| # | Call or booking benchmark | Value | Source | Scope |
|---|---|---|---|---|
| 36 | Calls included in Invoca's analysis | 60M+ | Invoca, 2025 | Multi-industry |
| 37 | Home-services phone leads converting during the call | 46% | Invoca, 2025 | Multiple home-service trades |
| 38 | Phone leads converting during the call across industries | 37% | Invoca, 2025 | Cross-industry |
| 39 | Callers who spoke with a person | 61% | Invoca, 2025 | Cross-industry |
| 40 | Digital-marketing calls that were qualified leads | 35% | Invoca, 2025 | Cross-industry |
| 41 | Lower end of reported call-answer range | 54% | Invoca, 2025 | Industry range |
| 42 | Upper end of reported call-answer range | 69% | Invoca, 2025 | Industry range |
| 43 | Calls rated excellent by contact-center managers | 28% | Invoca, 2025 | Manager rating |
| 44 | Agents who asked the lead to buy or book | 35% | Invoca, 2025 | Observed call behavior |
| 45 | Trade businesses in call-booking analysis | 3,000+ | ServiceTitan, 2022 | Platform businesses |
| 46 | Typical call booking rate | 42% | ServiceTitan, 2022 | Trade-business benchmark |
| 47 | Booking-rate improvement modeled | 5 points | ServiceTitan, 2022 | Illustrative scenario |
| 48 | Modeled revenue tied to that improvement | About $100,000 | ServiceTitan, 2022 | Not a guaranteed outcome |
| 49 | Technician cohort used in the revenue scenario | 5–14 techs | ServiceTitan, 2022 | Scenario boundary |
Owner takeaway: show the phone number clearly, set honest hours, route after-hours calls deliberately, and audit missed calls. Track the page, source, service requested, caller quality, answer outcome, booking, and completed job. That is the only way to tell a weak page from a strong page feeding a broken intake process.
5. Trust signals, booking preferences, and offer design
Housecall Pro surveyed 1,040 U.S. homeowner decision-makers in 2025. The findings describe home-service expectations rather than plumbing landing-page conversion lifts. They still help prioritize what should sit near the CTA: a professional experience, clear pricing expectations, real work proof, booking convenience, and payment options for larger jobs.
| # | Homeowner expectation | Value | Source | Landing-page use |
|---|---|---|---|---|
| 50 | Homeowner decision-makers in the survey | 1,040 | Housecall Pro, 2025 | Sample context |
| 51 | Homeowners willing to pay more for better service reputation | Over 70% | Housecall Pro, 2025 | Place proof near CTA |
| 52 | Homeowners willing to refer after an excellent experience | 73% | Housecall Pro, 2025 | Experience and referral context |
| 53 | Homeowners factoring online booking into provider choice | 80% | Housecall Pro, 2025 | Offer a monitored booking path |
| 54 | Homeowners expecting a professional, user-friendly website | 96% | Housecall Pro, 2025 | Baseline expectation |
| 55 | Millennials' likelihood versus boomers to rehire based on ease | Over 3× | Housecall Pro, 2025 | Generational comparison |
| 56 | Homeowners appreciating a technician name and photo before arrival | Nearly 60% | Housecall Pro, 2025 | Set post-booking expectations |
| 57 | Homeowners comfortable with AI handling initial inquiries | 53% | Housecall Pro, 2025 | Initial inquiries only |
| 58 | Homeowners expecting photo or video proof after work | 68% | Housecall Pro, 2025 | Show process and proof |
| 59 | Homeowners saying visual proof would be nice to receive | 28% | Housecall Pro, 2025 | Separate response group |
| 60 | Homeowners saying they would hire the same company again | 68% | Housecall Pro, 2025 | Repeat-hire intention |
| 61 | Homeowners influenced by visuals of past work | 92% | Housecall Pro, 2025 | Use real, relevant job photos |
| 62 | Homeowners saying instant estimates influence hiring | 93% | Housecall Pro, 2025 | Clarify estimate path |
| 63 | Homeowners frustrated by hidden costs | 77% | Housecall Pro, 2025 | Explain fees and next steps |
| 64 | Homeowners expecting payment plans or financing options | 55% | Housecall Pro, 2025 | Relevant for larger jobs |
Owner takeaway: the best offer is specific and operationally true. “Call now for same-day availability” can be stronger than a vague discount if dispatch can support it. For replacement or repair work, explain how estimates work, whether financing is available subject to approval, and what happens after submission. Add review proof and real job photos near the decision, using the placement principles in our plumbing website trust signals guide.
Two supporting datasets point in the same direction. BrightLocal's 2026 U.S. survey found 74% cared about reviews written within the last three months and 89% expected owners to respond. ServiceTitan reported in 2024 that 70% of consumers expected online booking and 94% of consumers looking for a new contractor were more likely to choose one that offered it. These are preference findings, not guaranteed landing-page lifts.
6. Form usability and accessibility statistics
A short form can still fail if its labels disappear, its error messages are unclear, or the submit control has no accessible name. WebAIM's 2026 Million study is an automated analysis of one million home pages, not a plumbing study and not a legal-compliance audit. It identifies common detectable failures that can also block conversion.
| # | Accessibility benchmark | Value | Source | Landing-page implication |
|---|---|---|---|---|
| 65 | Home pages with detected WCAG failures | 95.9% | WebAIM, 2026 | Automated detection only |
| 66 | Average detected accessibility errors per page | 56.1 | WebAIM, 2026 | One million home pages |
| 67 | Pages without detected WCAG failures | 4.1% | WebAIM, 2026 | Not proof of compliance |
| 68 | Pages with low-contrast text | 83.9% | WebAIM, 2026 | CTA and body readability |
| 69 | Pages with missing image alternative text | 53.1% | WebAIM, 2026 | At least one instance |
| 70 | Pages with missing form input labels | 51% | WebAIM, 2026 | Direct form usability risk |
| 71 | Pages with empty links | 46.3% | WebAIM, 2026 | Unclear interactive controls |
| 72 | Pages with empty buttons | 30.6% | WebAIM, 2026 | Submit and icon-button risk |
| 73 | Pages missing a document language | 13.5% | WebAIM, 2026 | Document-level issue |
| 74 | Pages using ARIA | 82.7% | WebAIM, 2026 | ARIA use is not compliance |
| 75 | Average detected errors on pages with ARIA versus without it | 59.1 vs. 42 | WebAIM, 2026 | Correlation, not causation |
| 76 | Share of page elements with a detected accessibility error | 3.9% | WebAIM, 2026 | Element-level measure |
Owner takeaway: keep the initial form to the information dispatch truly needs: name, contact method, location, service, and a short problem description. Use visible labels, large controls, clear errors, a useful success message, and an urgent-call alternative. Test by keyboard and on a real phone. An automated scan is only the first pass.
7. A/B testing and landing-page experiment benchmarks
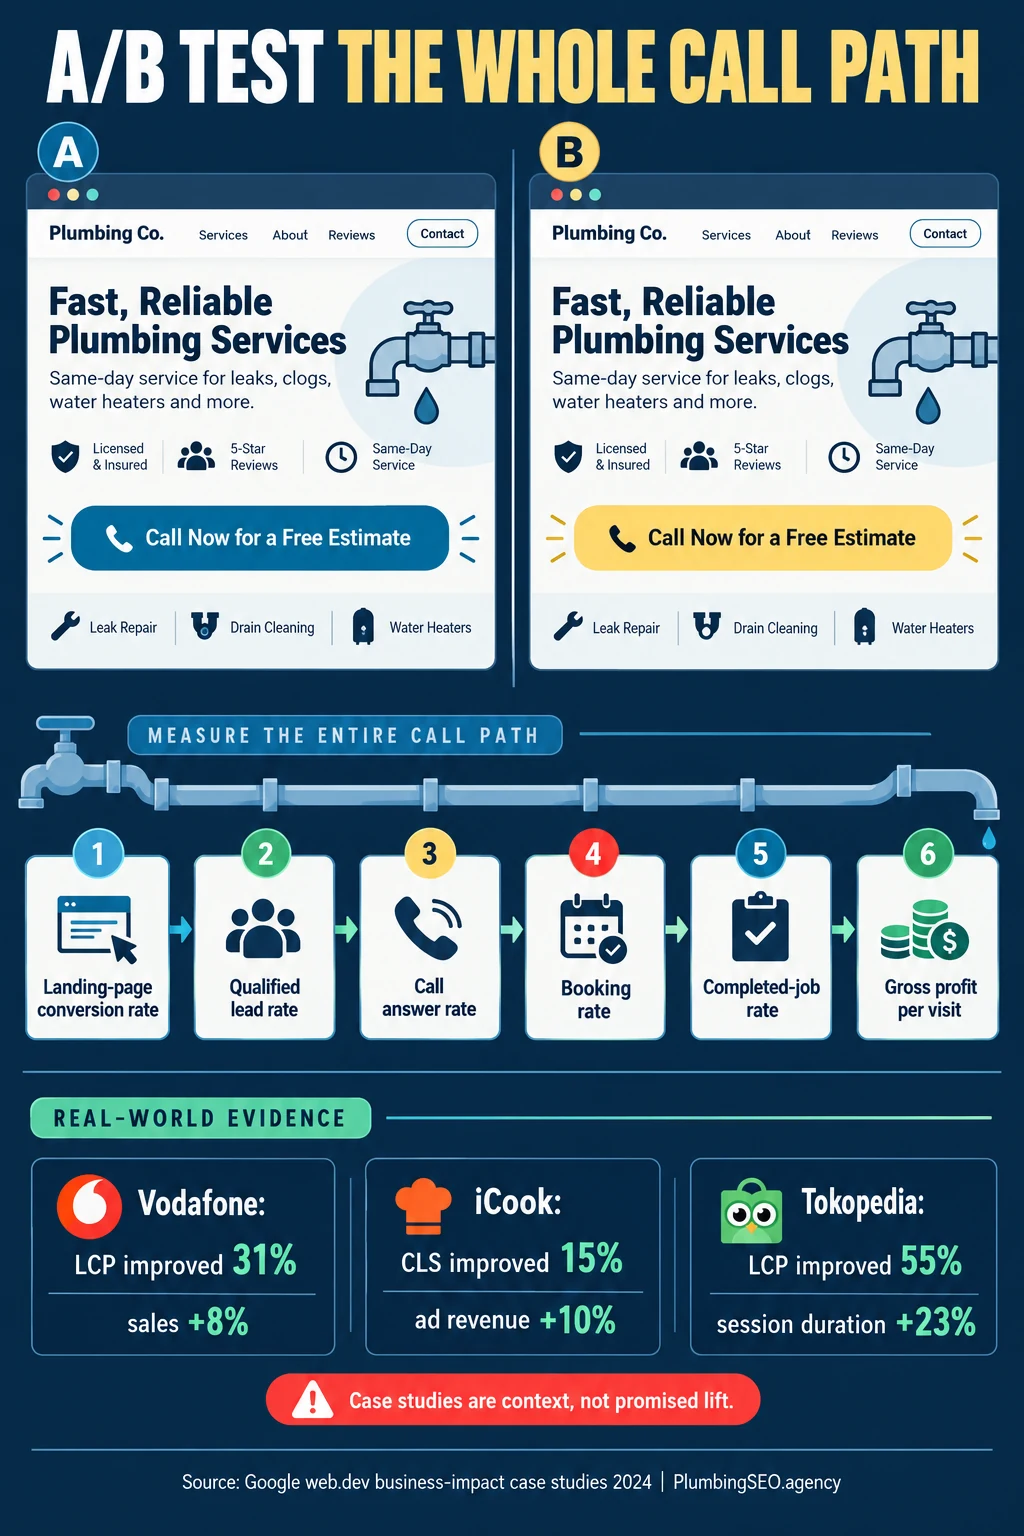
Unbounce's 2024 conversion report illustrates the scale available in a mature landing-page dataset, while Contentsquare's 2026 report shows the scale of digital-experience analysis. Neither provides a universal plumbing uplift. The Google web.dev examples below are named company case studies, not controlled guarantees for a plumbing company.
| # | Testing or research benchmark | Value | Source | Use |
|---|---|---|---|---|
| 77 | Landing pages in Unbounce's benchmark dataset | 41,000+ | Unbounce, 2024 | Cross-industry dataset scale |
| 78 | Unique visitors in the Unbounce dataset | 464M | Unbounce, 2024 | Cross-industry dataset scale |
| 79 | Conversions in the Unbounce dataset | 57M | Unbounce, 2024 | Definitions vary by page |
| 80 | Sites in Contentsquare's benchmark coverage | 6,500+ | Contentsquare, 2026 | Digital-experience context |
| 81 | Web and mobile sessions in Contentsquare's coverage | 99B | Contentsquare, 2026 | Dataset scale |
| 82 | Customer-service interactions in Contentsquare's coverage | 22M | Contentsquare, 2026 | Dataset scale |
| 83 | Vodafone Largest Contentful Paint improvement | 31% | Google web.dev, 2024 | Named company case study |
| 84 | Vodafone sales increase reported with the improvement | 8% | Google web.dev, 2024 | Context, not promised causality |
| 85 | iCook Cumulative Layout Shift improvement | 15% | Google web.dev, 2024 | Named company case study |
| 86 | iCook ad-revenue increase reported with the improvement | 10% | Google web.dev, 2024 | Different business model |
| 87 | Tokopedia Largest Contentful Paint improvement | 55% | Google web.dev, 2024 | Named company case study |
| 88 | Tokopedia average-session-duration improvement reported | 23% | Google web.dev, 2024 | Not a plumbing conversion result |
A practical plumbing A/B test sequence
- Write one hypothesis. Example: showing “serving Dallas and nearby areas” beside the CTA will reduce out-of-area calls without lowering qualified leads.
- Choose one primary outcome. Prefer qualified lead rate, booking rate, or profit per visit over raw button taps.
- Change one decision variable. Test the headline, offer, CTA, proof block, form length, or call-first layout—not all of them at once.
- QA the plumbing. Confirm both variants have working phone numbers, forms, source tracking, availability language, and equal dispatch treatment.
- Run through normal variation. Do not call a winner after one large sewer job, one quiet weekend, or a handful of clicks. Use a sample-size plan suited to your baseline and minimum detectable effect.
- Read downstream quality. Segment spam, wrong service, out-of-area, qualified, booked, canceled, completed, revenue, and gross profit.
The big research datasets are a reminder that reliable conclusions require volume and clean definitions. A local plumber with limited traffic may learn faster by testing a large, operationally meaningful change across a longer window than by rotating five button colors and hoping one becomes magic.
What plumbing companies should fix first
Do not turn 88 data points into 88 design changes. Repair the shortest path from relevant visit to answered, qualified, booked call.
1Match the intent
Use one primary service, one honest availability promise, and clear service-area language. Keep ad, keyword, headline, and offer aligned.
2Protect the mobile first screen
Show service, location, trust, and a tappable call action without requiring a menu or long scroll.
3Remove load and layout friction
Prioritize the hero, limit scripts, size images, stabilize the CTA, and use field Core Web Vitals where available.
4Make the offer concrete
Explain response windows, estimate process, fees, financing eligibility, and what happens after the call or form.
5Fix the intake handoff
Measure answer rate, callback speed, qualification, booking asks, bookings, cancellations, and completed jobs.
6Test for profit
Run one hypothesis at a time and grade the result on qualified work and gross profit, not decorative engagement.
Use our emergency plumbing landing page checklist for urgent-call QA, then compare the surrounding site with our plumbing website statistics. If the page, tracking, and local visibility need a wider review, request a free plumbing SEO audit.
Methodology and source notes
This article was published October 21, 2026. It includes 88 numbered statistics and supporting cross-checks from 16 source families. We prioritized original publishers, large datasets, first-party product guidance, and identifiable trade research. Each numbered row preserves its source and scope.
What we excluded: unsupported “average plumbing landing page” conversion claims, anonymous agency roundups, uncited form-length lifts, and A/B testing statistics without a traceable original source. Plumbing-only data is labeled. Home-services, cross-industry, web-wide, survey, historical, and case-study figures are not presented as plumbing guarantees.
- LocaliQ Home Services Search Advertising Benchmarks (2025) — more than 3,200 campaigns from April 2024 through March 2025; includes a plumbing row.
- Think with Google local-search research — historical mobile and nearby-search behavior.
- Pew Research Center Mobile Fact Sheet (2025) — U.S. adult cellphone, smartphone, and smartphone-only access.
- Think with Google Mobile Speed Research (2017) — historical load, bounce, and page-complexity findings.
- HTTP Archive 2025 Web Almanac: Performance — web-wide mobile and desktop performance distributions, published in 2026.
- Google web.dev Core Web Vitals — current metric definitions and good thresholds at the 75th percentile.
- Invoca call-performance data reported by Supply House Times (2025) — more than 60 million calls, including home-services call conversion.
- ServiceTitan call-booking analysis (2022) — more than 3,000 platform trade businesses; dated and platform-specific.
- Housecall Pro Homeowner Service Report (2025) — online survey of 1,040 U.S. homeowner decision-makers.
- WebAIM Million (2026) — automated accessibility analysis of one million home pages.
- Unbounce Conversion Benchmark Report (2024) — more than 41,000 landing pages, 464 million visitors, and 57 million conversions.
- Contentsquare Digital Experience Benchmarks (2026) — more than 6,500 sites and 99 billion sessions.
- Google web.dev business-impact case studies (2024) — named company examples connecting performance improvements with reported business outcomes.
- BrightLocal Local Consumer Review Survey (2026) — recent-review and owner-response expectations among U.S. consumers.
- Statcounter U.S. platform traffic snapshot (August 2026) — dated device-traffic context, not plumbing leads.
- ServiceTitan online-booking preference report (2024) — consumer booking preferences, not a conversion guarantee.
Frequently asked questions about plumbing landing pages
There is no universal rate because traffic source and conversion definitions vary. LocaliQ reported 7.63% for plumbing paid-search campaigns in its 2025 home-services dataset. Compare that only with similarly configured paid traffic, then track qualified leads and booked jobs.
Show the service, location or service area, honest availability, primary call action, visible phone number, and one strong trust signal. The visitor should understand who can help, where, and what to do next before scrolling.
Support both, but prioritize the path that matches intent. Emergency traffic often needs a phone-first experience. Planned projects may benefit from a short form or monitored online booking. Measure qualification and booking from each path.
Use Google's good Core Web Vitals thresholds at the 75th percentile: LCP at or below 2.5 seconds, INP at or below 200 milliseconds, and CLS at or below 0.1. Test field data where available and prioritize the mobile first screen.
Test a meaningful decision variable: message match, service-area clarity, availability offer, call-first versus form-first layout, trust proof near the CTA, or a shorter form. Use one primary downstream outcome and avoid declaring a winner from a tiny sample.
The page may be counting low-quality events, attracting the wrong service or geography, or handing calls to a weak intake process. Track qualification, answer rate, booking asks, bookings, cancellations, completed jobs, revenue, and gross profit.
Is your plumbing landing page leaking qualified calls?
Get a practical review of message match, mobile speed, trust, forms, call tracking, local visibility, and the handoff from visit to booked job.
Run My Free SEO Leak Check