
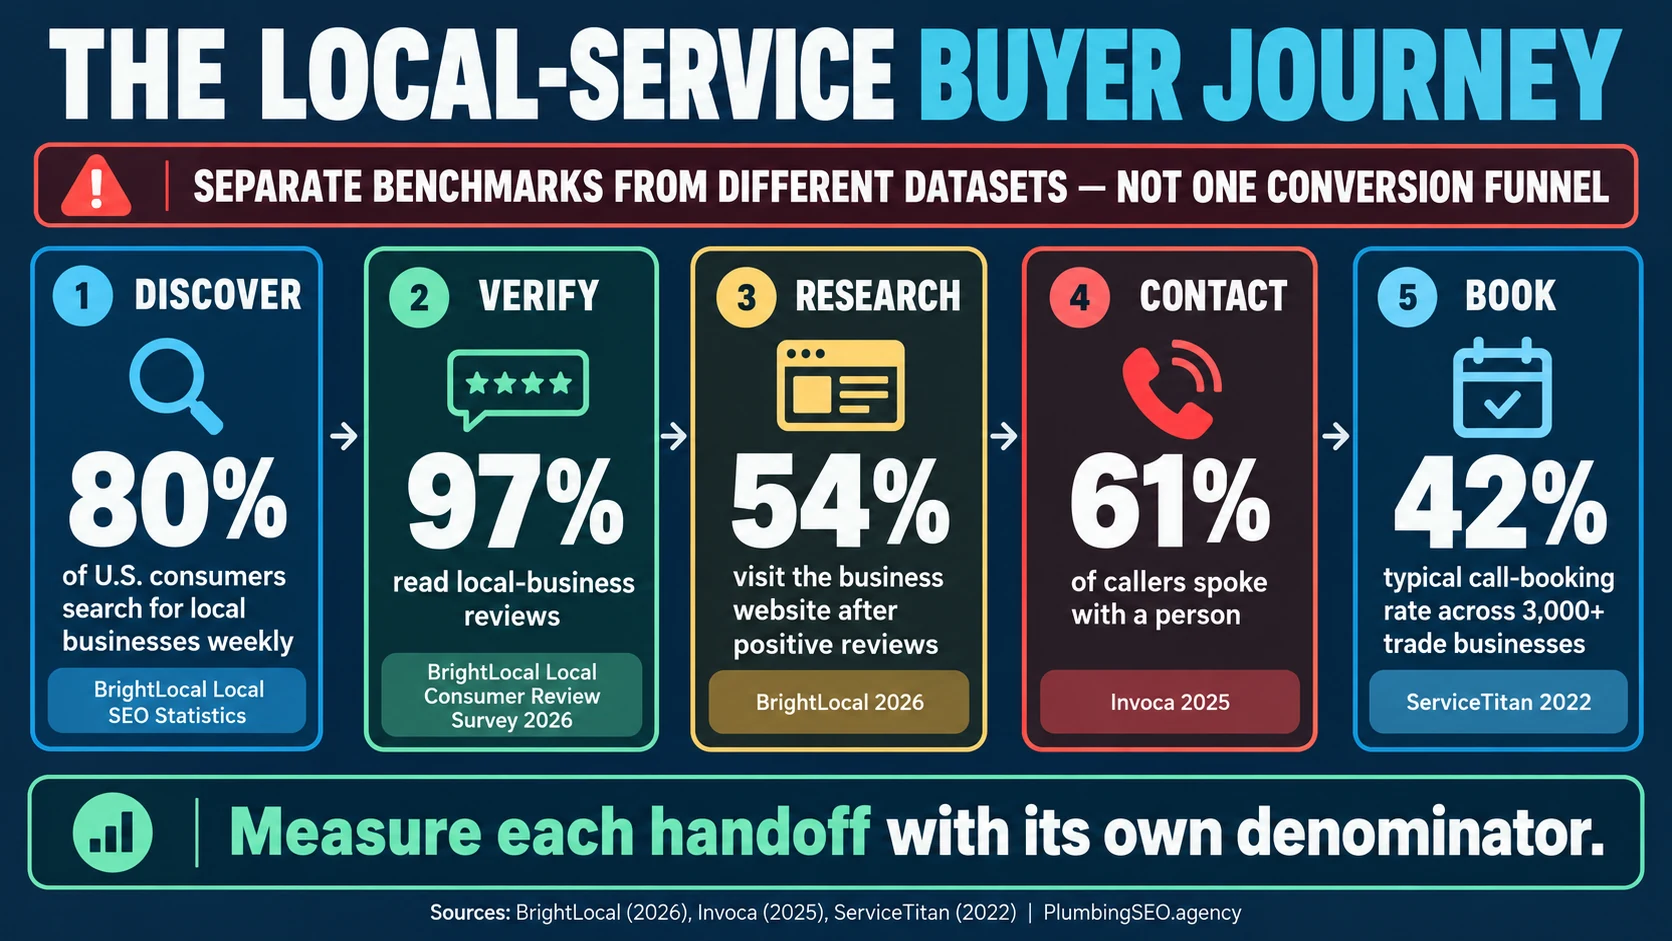
- Discovery is habitual and fragmented: 80% of U.S. consumers search for local businesses weekly, while referrals, Google, social platforms, Maps, review sites, and AI can all influence the path.
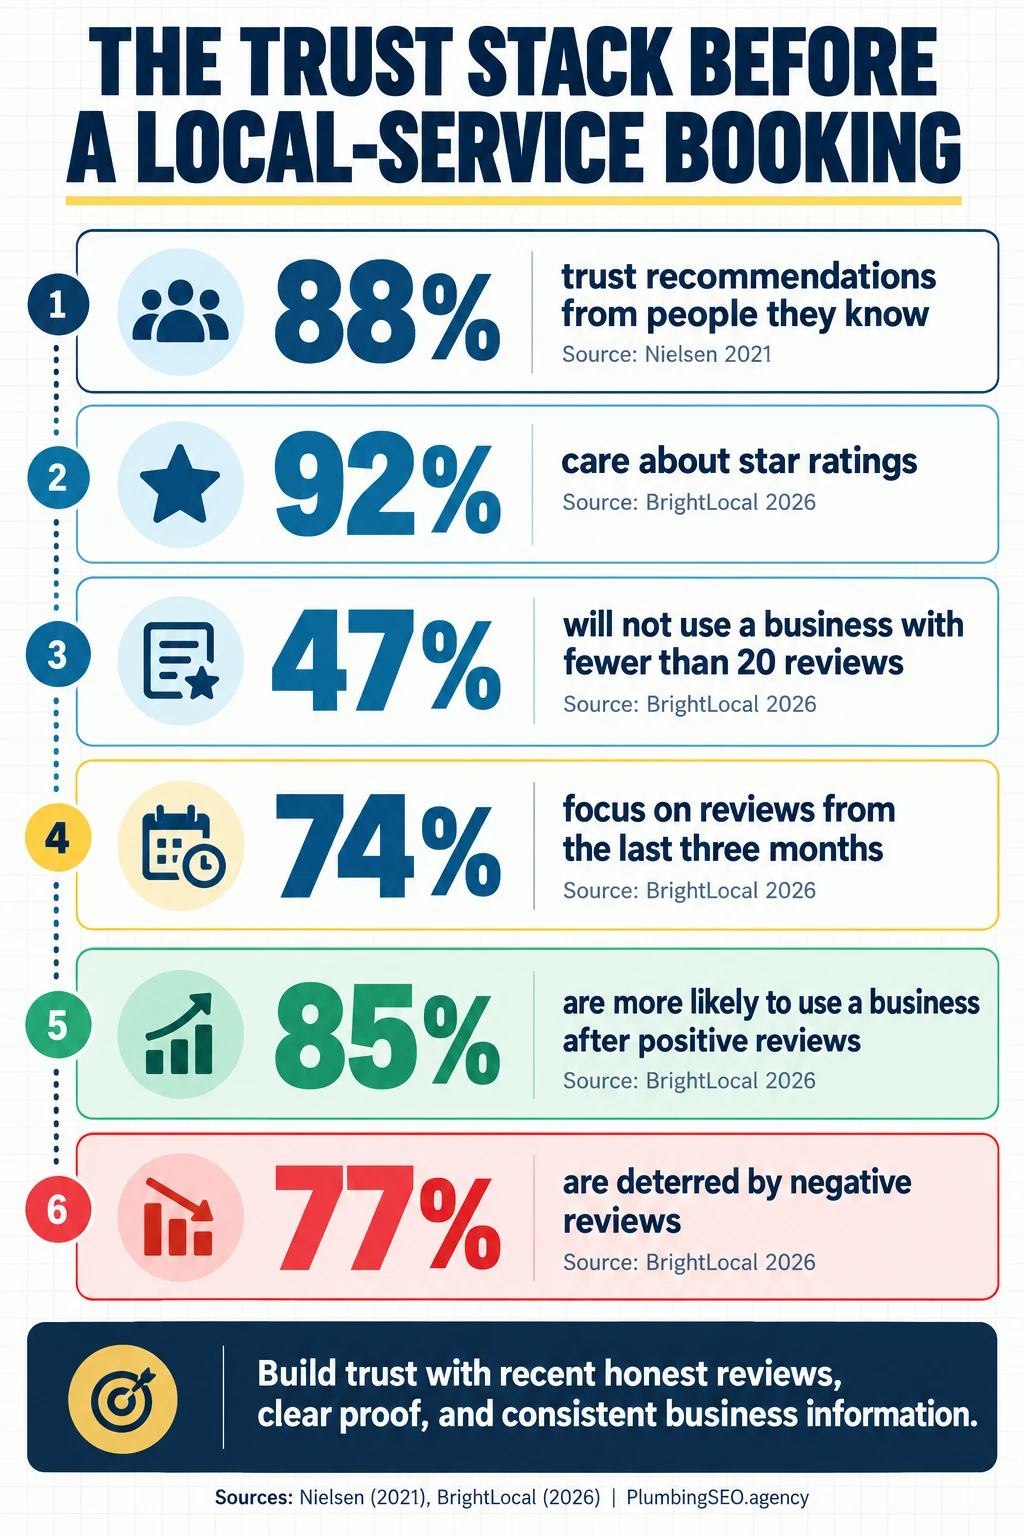
- Trust is a qualification gate: 97% read local-business reviews, 92% care about star ratings, and 74% focus on reviews from the last three months.
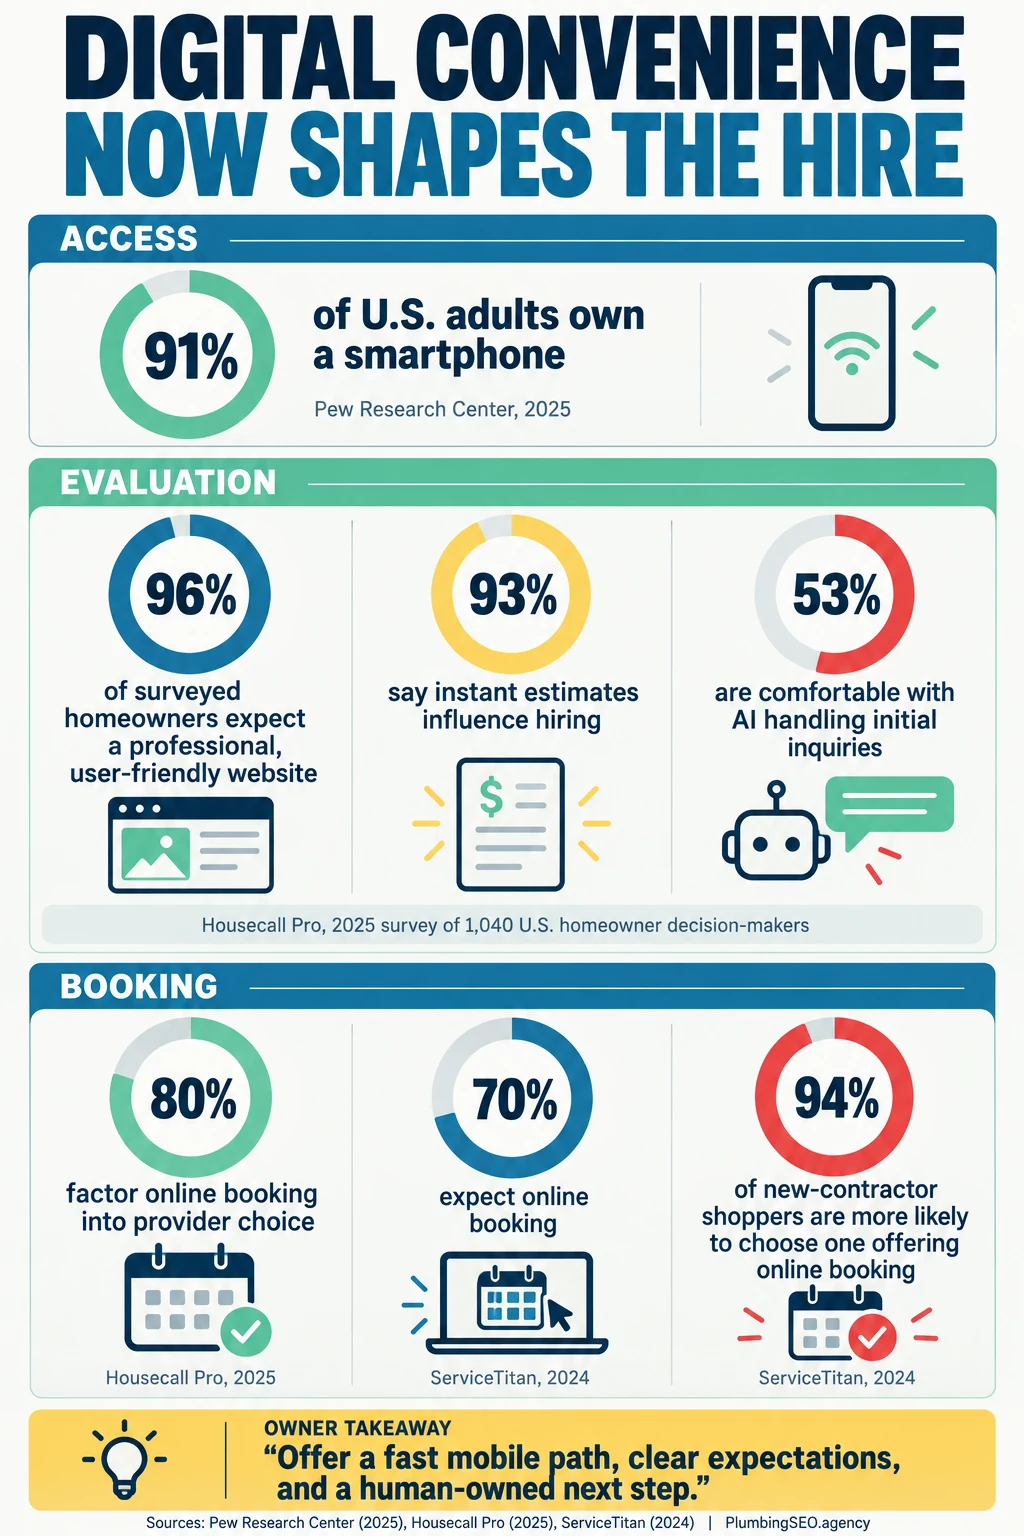
- Convenience shapes provider choice: 80% of surveyed homeowners factored online booking into their choice, and more than half of home-service customers in Jobber's research expected a response within an hour.
- A contact is not a booking: answer rate, live conversation, qualified lead, appointment, completed job, and collected revenue need separate denominators.
How do customers choose a local plumber, HVAC company, electrician, roofer, landscaper, cleaner, or other nearby provider? Usually not through one clean channel. A customer may hear a neighbor's recommendation, search Google, compare map listings, read reviews, visit two websites, call one company, then book the business that responds clearly.
This guide compiles 75 numbered local-service consumer behavior benchmarks across that journey. It emphasizes plumbing and home services, but several sources cover broader local consumers or cross-industry customer behavior. Every table labels the scope so a directional benchmark does not become a false plumbing guarantee.
1. Discovery channels and local search behavior
Local discovery is neither search-only nor referral-only. BrightLocal measures consumer search and recommendation behavior, while Jobber asks home-service owners which channels produce leads. Those are different perspectives, and Jobber's channel answers overlap.
| # | Discovery benchmark | Value | Source | Scope and interpretation |
|---|---|---|---|---|
| 1 | U.S. consumers who search online for local businesses weekly | 80% | BrightLocal local SEO statistics | Recurring local discovery habit |
| 2 | U.S. consumers who search online for local businesses daily | 32% | BrightLocal | Daily search behavior |
| 3 | Consumers who always or often add “near me” to local queries | 46% | BrightLocal | Reported query habit |
| 4 | Consumers using business-information sites to research a new local business | 61% | BrightLocal | Includes Google, Yelp, Tripadvisor, and BBB examples |
| 5 | Consumers using Google for local business information | 72% | BrightLocal | Local-information behavior |
| 6 | Home-service businesses reporting referrals as a lead source | 59% | Jobber, 2026 | 1,000+ U.S. owners; sources overlap |
| 7 | Home-service businesses reporting Facebook as a lead source | 32% | Jobber, 2026 | Owner-reported channel prevalence |
| 8 | Home-service businesses reporting Google Search as a lead source | 20% | Jobber, 2026 | Not share of all leads |
| 9 | Home-service businesses reporting Google Local Services Ads as a lead source | 19% | Jobber, 2026 | Not an LSA conversion rate |
| 10 | Consumers using Google for local reviews and recommendations | 71% | BrightLocal, 2026 | U.S. local-consumer survey |
| 11 | Consumers using ChatGPT or other AI tools for local recommendations | 45% | BrightLocal, 2026 | Reported recommendation-platform use |
| 12 | Prior-year AI-tool usage for local recommendations | 6% | BrightLocal, 2026 report | Prior survey baseline, not a market forecast |
| 13 | Consumers using Apple Maps for local recommendations | 27% | BrightLocal, 2026 | Platform usage |
| 14 | Consumers using local news sites for local recommendations | 29% | BrightLocal, 2026 | Local editorial discovery remains part of the mix |
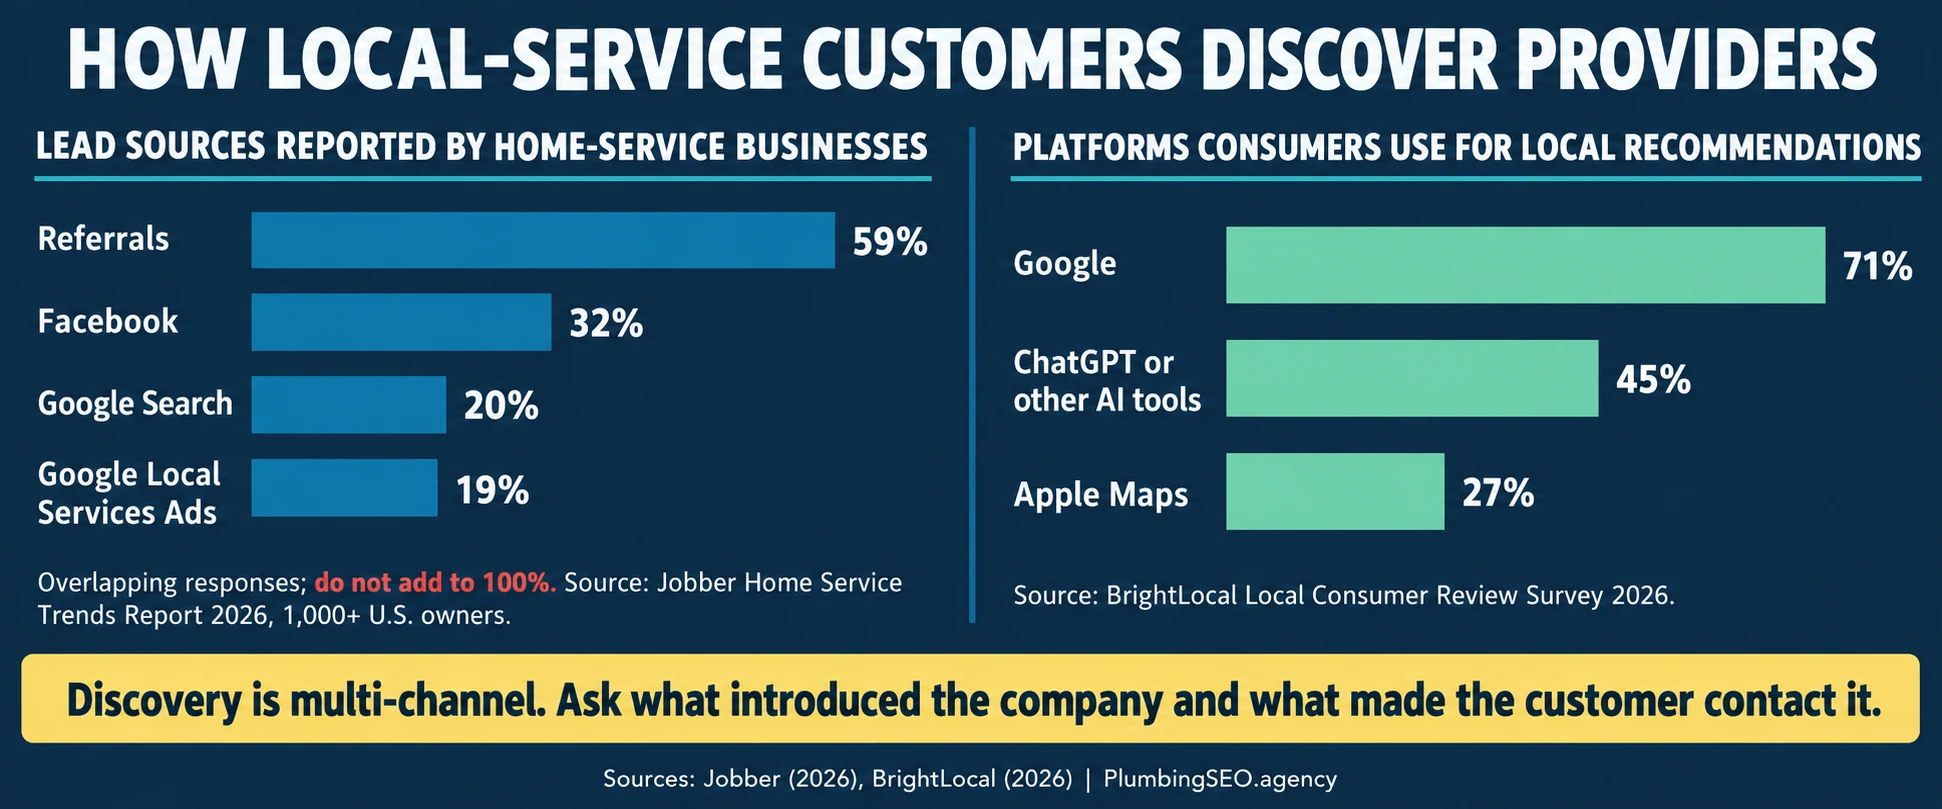
Owner takeaway: ask two questions in your lead CRM: “How did you first hear about us?” and “What made you contact us today?” A referral can create awareness while Google, reviews, or a website supplies the final proof.
2. Local search, Maps, and profile-choice statistics
Search visibility only starts the decision. Consumers also respond to profile completeness, accurate hours, proximity, ratings, and an immediate mobile action. For a deeper view of local discovery, see our near me search statistics.
| # | Local-choice benchmark | Value | Source | Operational meaning |
|---|---|---|---|---|
| 15 | Local searchers who click Google map-pack results | 42% | BrightLocal | Maps visibility can create the first action |
| 16 | Consumers conducting local searches directly in map products | 1 in 5 | BrightLocal | Some journeys begin inside Maps |
| 17 | Consumers who would avoid a business after finding incorrect information online | 62% | BrightLocal | Audit phone, hours, address, and service area |
| 18 | Consumers who would choose a nearby alternative when the intended business was closed | 47% | BrightLocal | Accurate hours and after-hours routing matter |
| 19 | Greater likelihood of considering a business reputable with a complete Business Profile | 2.7× | BrightLocal citing Google | Completeness supports perceived legitimacy |
| 20 | Greater likelihood of visiting a business with a complete Google Business Profile | 70% | BrightLocal citing Google | Visit intent; not necessarily a service booking |
| 21 | Greater likelihood of considering a purchase from a business with a complete profile | 50% | BrightLocal citing Google | Purchase consideration, not completed revenue |
| 22 | Main factors Google names for local results | 3 | Google Business Profile Help | Relevance, distance, and prominence |
| 23 | Smartphone users who contacted a business directly from search results | 60% | SOCi local SEO statistics | Mobile call and message paths must work |
| 24 | More actions received by Google 3-pack businesses than positions 4–10 | 93% | SOCi | Source-reported comparison, not universal uplift |
| 25 | More traffic received by Google 3-pack businesses than positions 4–10 | 126% | SOCi | Source-reported ranking-group comparison |
3. Reviews, reputation, and trust statistics
Personal recommendations begin with unusually strong trust, but consumers still verify providers publicly. BrightLocal's 2026 survey shows that count, rating, recency, sentiment, and owner response are different filters. Our full online review statistics report covers this decision layer in more depth.
| # | Trust benchmark | Value | Source | What it measures |
|---|---|---|---|---|
| 26 | Consumers trusting recommendations from people they know above other channels | 88% | Nielsen, 2021 | Global advertising-trust research |
| 27 | Consumers who read reviews for local businesses | 97% | BrightLocal, 2026 | U.S. local-consumer behavior |
| 28 | Consumers who always read reviews while browsing businesses | 41% | BrightLocal | Frequency of review reading |
| 29 | Average review sites used when choosing a business | 6 sites | BrightLocal | Cross-platform research breadth |
| 30 | Consumers who will not use a business with fewer than 20 reviews | 47% | BrightLocal | Review-count threshold |
| 31 | Consumers willing to use a business with five or fewer reviews | 9% | BrightLocal | Tolerance for a thin review profile |
| 32 | Consumers who care about star ratings when choosing a business | 92% | BrightLocal | Rating importance |
| 33 | Consumers who will only use businesses with 4.5 stars or more | 31% | BrightLocal | High rating threshold |
| 34 | Consumers who will only use businesses with four or more stars | 68% | BrightLocal | Four-star threshold |
| 35 | Consumers focused on reviews from the last three months | 74% | BrightLocal | Review recency |
| 36 | Consumers looking for reviews from the last two weeks | 32% | BrightLocal | Very recent proof |
| 37 | Consumers more likely to use a business after positive reviews | 85% | BrightLocal | Reported influence, not observed booking |
| 38 | Consumers deterred by negative reviews | 77% | BrightLocal | Reported deterrence |
| 39 | Consumers ready to buy or book after positive reviews | 34% | BrightLocal | Stated readiness, not confirmed transaction |
| 40 | Consumers visiting a business website after positive reviews | 54% | BrightLocal | Website research action |
| 41 | Consumers likely to use a business that responds to every review | 80% | BrightLocal | Reported response influence |
| 42 | Consumers concerned about fake reviews | 75% | Capital One Shopping, 2026 | Broad shopper research, not home-service-only |
4. Website, estimate, and booking-convenience statistics
Housecall Pro surveyed 1,040 U.S. homeowner decision-makers in 2025. The results describe stated expectations across home services, not audited plumbing transactions. ServiceTitan's figures add contractor-booking context. Together they show that the website is part of service delivery before a technician arrives.
| # | Digital-evaluation benchmark | Value | Source | Scope |
|---|---|---|---|---|
| 43 | U.S. homeowner decision-makers surveyed | 1,040 | Housecall Pro, 2025 | Survey sample |
| 44 | Homeowners willing to pay more for a pro with a better service reputation | Over 70% | Housecall Pro | Stated willingness, not realized price premium |
| 45 | Homeowners expecting a professional, user-friendly website | 96% | Housecall Pro | Digital trust expectation |
| 46 | Homeowners factoring online booking into provider choice | 80% | Housecall Pro | Selection factor |
| 47 | Homeowners influenced by visuals of past work | 92% | Housecall Pro | Visual proof influences hiring |
| 48 | Homeowners saying instant estimates influence hiring | 93% | Housecall Pro | Influence, not demand for blind fixed quotes |
| 49 | Homeowners frustrated by hidden costs | 77% | Housecall Pro | Pricing transparency expectation |
| 50 | Homeowners expecting payment plans or financing options | 55% | Housecall Pro | Home-service payment expectation |
| 51 | Homeowners expecting photo or video proof after work | 68% | Housecall Pro | Post-work documentation |
| 52 | Homeowners appreciating a technician name and photo before arrival | Nearly 60% | Housecall Pro | Pre-arrival trust cue |
| 53 | Homeowners comfortable with AI handling initial inquiries | 53% | Housecall Pro | Initial inquiry only; human escalation still matters |
| 54 | Consumers reported as expecting online booking | 70% | ServiceTitan, 2024 | Contractor-booking context |
| 55 | New-contractor shoppers more likely to choose one offering online booking | 94% | ServiceTitan | Reported likelihood, not booking-rate lift |
Owner takeaway: “instant estimate” should not mean promising a final price before diagnosis. Show what can be estimated remotely, what requires inspection, whether a dispatch or diagnostic charge applies, and what happens after a customer submits the request.
5. Response, phone-contact, and booking statistics
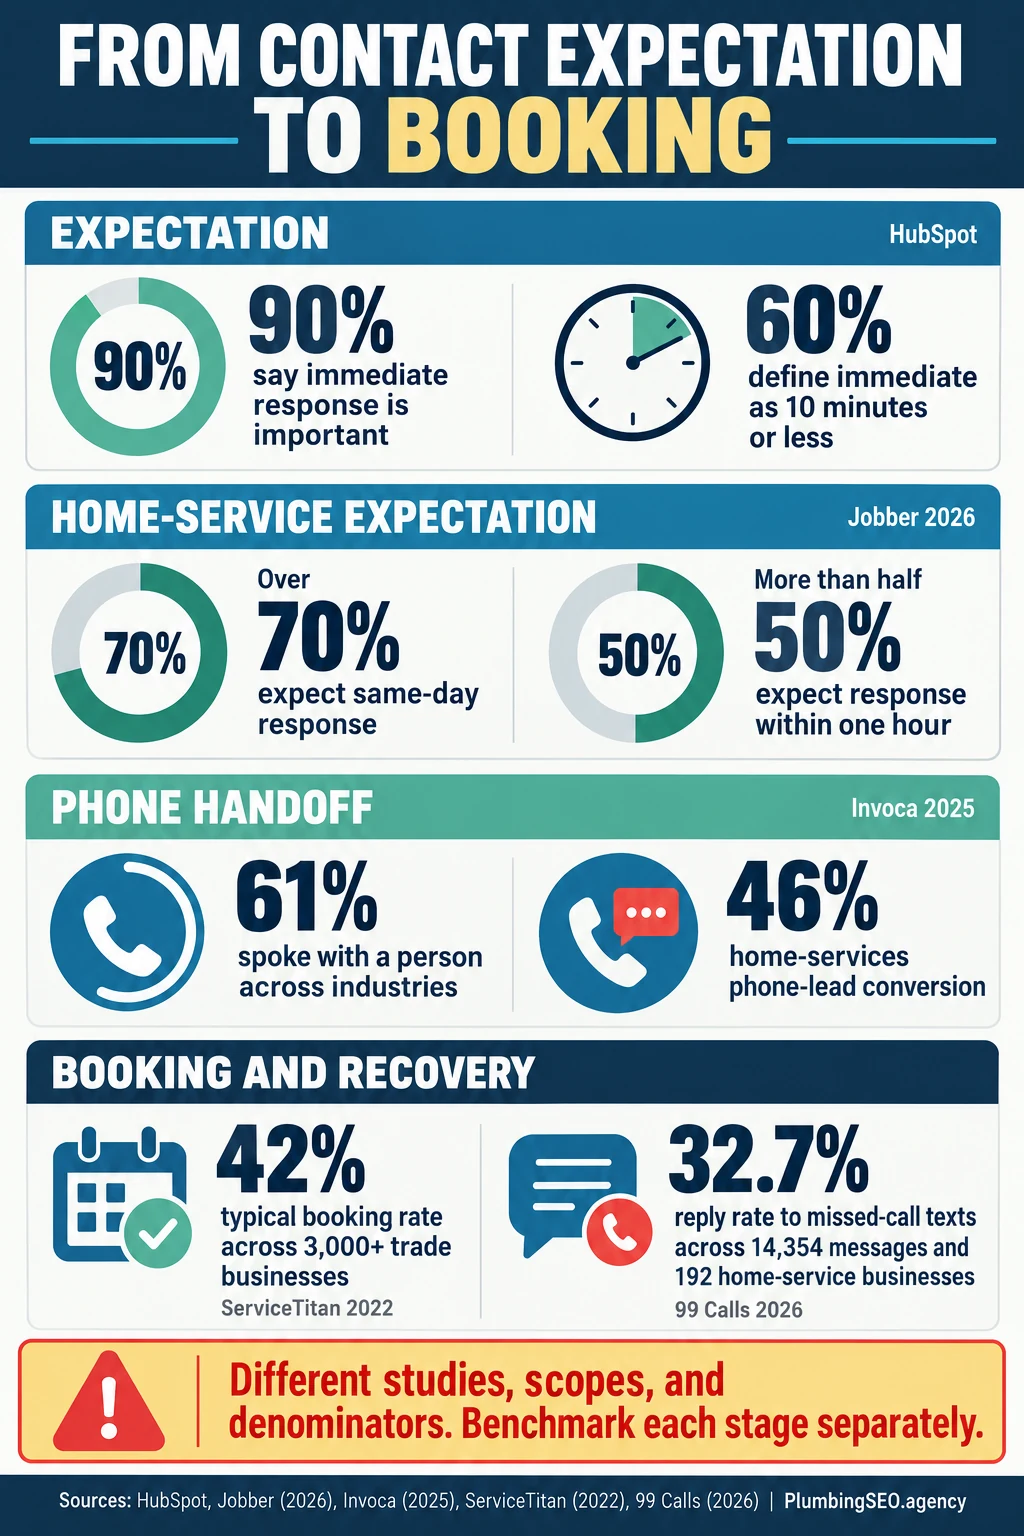
Response expectations come from surveys; call outcomes come from platform datasets. Invoca's 2025 reporting covers more than 60 million calls and includes a home-services segment. ServiceTitan analyzed more than 3,000 trade businesses. None of these figures is a universal close-rate target for one plumbing shop.
| # | Contact or booking benchmark | Value | Source | Definition warning |
|---|---|---|---|---|
| 56 | Home-service customers expecting a same-day response | Over 70% | Jobber, 2026 | Response expectation |
| 57 | Home-service customers expecting a response within one hour | More than half | Jobber, 2026 | Response expectation |
| 58 | Customers rating an immediate response important or very important | 90% | HubSpot | Cross-industry expectation |
| 59 | Customers defining immediate response as ten minutes or less | 60% | HubSpot | Cross-industry definition |
| 60 | Calls represented in Invoca reporting | 60M+ | Invoca via Supply House Times, 2025 | Dataset scale |
| 61 | Callers who spoke with a person | 61% | Invoca | Live conversation, not a booking |
| 62 | Home-services phone leads converting during the call | 46% | Invoca | Home-services segment; source conversion definition |
| 63 | Phone leads converting during the call across industries | 37% | Invoca | Cross-industry comparison |
| 64 | Calls from digital marketing classified as qualified leads | 35% | Invoca | Qualified-call share, not conversion |
| 65 | Range in call-answer rates across measured industries | 54%–69% | Invoca | Industry range, not target |
| 66 | Agents who asked leads to buy or book | 35% | Invoca | Call-handling behavior |
| 67 | Typical call-booking rate in an analysis of 3,000+ trade businesses | 42% | ServiceTitan, 2022 | Multi-trade platform analysis |
6. Missed-call recovery, repeat choice, and loyalty statistics
A local-service journey does not end at the first failed call or first completed job. 99 Calls measures replies to missed-call texts, Housecall Pro measures repeat and referral intent, Salesforce measures stated repurchase likelihood, and PwC supplies broader experience-risk context. These outcomes should remain separate.
| # | Recovery or loyalty benchmark | Value | Source | What it means |
|---|---|---|---|---|
| 68 | Missed-call text-back messages analyzed | 14,354 | 99 Calls, 2026 | Study message count |
| 69 | Home-service businesses represented | 192 | 99 Calls | Multi-trade study sample |
| 70 | Reply rate to missed-call text-back messages | 32.7% | 99 Calls | Replies, not contacts or bookings |
| 71 | Text-back replies arriving within five minutes | 74% | 99 Calls | Share of replies, not all messages |
| 72 | Homeowners saying they would hire the same company again | 68% | Housecall Pro, 2025 | Repeat-hire intent, not observed retention |
| 73 | Homeowners willing to refer after an excellent experience | 73% | Housecall Pro | Referral intent, not a verified referral |
| 74 | Customers saying good service makes another purchase more likely | 94% | Salesforce | Cross-industry stated likelihood |
| 75 | Consumers who would leave a brand they love after one bad experience | 32% | PwC | Global cross-industry result |
Measure actual returns and introductions with the same care as first-time acquisition. The related guides to plumbing customer retention and plumbing referral marketing separate stated intent from completed, profitable behavior.
Local-service consumer behavior statistics: journey summary
This compact index shows what each numbered group can and cannot answer. Follow the linked sources in the primary tables before using a figure in a plan, forecast, or presentation.
| Rows | Journey stage | Count | Primary evidence | Best operational use |
|---|---|---|---|---|
| 1–14 | Discovery channels and search behavior | 14 | BrightLocal, Jobber | Source capture and channel coverage |
| 15–25 | Local search, Maps, and profile choice | 11 | BrightLocal, Google, SOCi | Profile accuracy and mobile action paths |
| 26–42 | Reviews, reputation, and trust | 17 | Nielsen, BrightLocal, Capital One Shopping | Review operations and trust proof |
| 43–55 | Website, estimate, and booking convenience | 13 | Housecall Pro, ServiceTitan | Digital experience and provider selection |
| 56–67 | Response, phone contact, and booking | 12 | Jobber, HubSpot, Invoca, ServiceTitan | Handoff definitions and call coaching |
| 68–75 | Recovery, repeat choice, and loyalty | 8 | 99 Calls, Housecall Pro, Salesforce, PwC | Recovery, repeat intent, and experience risk |
Build an attribution model around the real customer journey
Last-click reporting gives all credit to the final measurable interaction. First-touch reporting gives it to the introduction. Neither explains a journey in which a referral creates awareness, Google supplies the phone number, reviews reduce risk, and the website makes booking easy.
Discovery source
First known source or recommendationAsk how the customer first learned the company's name. Preserve “friend,” “neighbor,” “realtor,” or “past customer” instead of overwriting it with Google.
Decision influence
What made the customer contact nowCapture reviews, availability, location, service proof, financing, website clarity, promotion, prior experience, or urgency.
Contact rate
Leads with two-way contact ÷ valid leadsDefine valid lead, exclude spam, and distinguish automated acknowledgment from a human conversation.
Booking rate
Booked appointments ÷ qualified contacted leadsDo not use all calls in the denominator unless wrong numbers, vendors, spam, and out-of-area requests are intentionally included.
Completed-job rate
Completed paid jobs ÷ booked appointmentsSeparate cancellations, reschedules, no-shows, warranty visits, and no-charge recovery work.
Source gross profit
Collected revenue − direct job costs − channel costsCompare source quality on collected gross profit, not leads, clicks, or booked revenue alone.
A practical local-service consumer-behavior action plan
1Win discovery accuracy
Standardize the business name, phone, hours, service area, categories, booking link, and emergency availability across Google, the website, directories, and major review surfaces.
2Publish decision proof
Build specific service pages, real project evidence, licensing and insurance context, technician information, warranty explanations, financing details, and clear location coverage.
3Keep reviews current
Ask every eligible completed customer for honest feedback. Respond specifically, route complaints to an owner, and track repeated themes by job type and team.
4Remove booking friction
Make phone, form, and online request paths work on mobile. Explain what happens next, which requests are monitored after hours, and when a human will respond.
5Own every lead handoff
Assign calls and forms to named staff, use overflow coverage, send an accurate acknowledgment, recover missed calls, and stop automation when a person takes over.
6Report outcomes, not activity
Connect discovery source to qualified contact, appointment, completed job, collected revenue, gross profit, review, referral, and return. Review one leak each week.
For plumbing companies, these improvements should support both visibility and operations. Our plumbing SEO agency focuses on the local search, website, proof, and tracking layers that influence real calls—not rankings in isolation.
Methodology, statistic count, and source inventory
This article was published October 21, 2026. The promised total is the 75 numbered rows in the six primary tables: 14 discovery + 11 local choice + 17 trust + 13 digital evaluation + 12 response and booking + 8 recovery and loyalty = 75. Hero cards, infographic labels, formulas, sample explanations, and FAQ answers do not inflate the count.
We prioritized 17 named source records: surveys, first-party platform analyses, established research organizations, and sources with visible scope. The guide intentionally combines studies because no single public dataset follows one representative U.S. local-service consumer from first awareness through completed job and repeat purchase. We do not blend those studies into a synthetic conversion funnel.
- BrightLocal Local SEO Statistics — local search frequency, Maps, profile completeness, accuracy, and mobile-action context.
- BrightLocal Local Consumer Review Survey (2026) — U.S. review discovery, platform use, count, rating, recency, sentiment, response, and next-action behavior.
- Jobber Home Service Trends Report (2026) — survey of more than 1,000 U.S. home-service business owners covering lead sources, response expectations, and satisfaction drivers.
- Google Business Profile Help — first-party description of relevance, distance, and prominence in local results.
- SOCi local SEO statistics — map-pack traffic, action, and mobile contact context.
- Nielsen Trust in Advertising (2021) — global consumer trust in recommendations from people they know.
- Capital One Shopping Online Reviews Statistics (2026) — broad U.S. shopper research on review influence and fake-review concern.
- Housecall Pro Home Service Customer Service Report (2025) — online survey of 1,040 U.S. homeowner decision-makers.
- ServiceTitan online-booking research (2024) — contractor booking expectations and platform context.
- HubSpot customer-service statistics — cross-industry immediate-response expectations.
- Invoca call benchmarks via Supply House Times (2025) — more than 60 million calls with home-services segment reporting.
- ServiceTitan call-booking analysis (2022) — analysis of more than 3,000 trade businesses.
- 99 Calls Missed-Call Text-Back Study (2026) — 14,354 messages across 192 home-service businesses.
- Salesforce State of the Connected Customer — cross-industry service and repurchase expectations.
- PwC Future of Customer Experience — cross-industry buying, experience, convenience, and customer-loss research.
- Pew Research Center Mobile Fact Sheet (2025) — supporting U.S. mobile-access context shown in the digital-convenience infographic.
- DataReportal Digital 2025: United States of America — supporting U.S. internet and mobile-adoption context for the discovery and digital-convenience sections.
Local-service consumer behavior statistics FAQ
They use overlapping paths: referrals, Google Search, Maps, review sites, social platforms, business websites, local media, ads, and increasingly AI recommendation tools. A customer may use several sources before contacting one provider.
No single factor decides every hire. The evidence points to accurate local information, recommendation trust, review count and recency, clear service proof, website usability, availability, transparent expectations, easy booking, and fast human follow-up.
BrightLocal's 2026 U.S. survey found 97% read local-business reviews, 92% care about star ratings, 47% will not use a business with fewer than 20 reviews, and 74% focus on reviews from the last three months. These are consumer survey findings, not guaranteed booking outcomes.
Jobber reported that more than half of home-service customers expected a response within one hour and over 70% expected a same-day response. Set a response standard by channel and time of day, then distinguish automated acknowledgment from the first useful human response.
There is no universal rate. ServiceTitan reported a typical 42% call-booking rate in an analysis of more than 3,000 trade businesses, but service mix, lead source, qualification rules, geography, hours, pricing, and denominator design all change the result.
Keep first discovery, decision influence, and final contact method as separate fields. Then connect each lead to qualification, appointment, completed work, collected revenue, gross profit, review, referral, and repeat business instead of assigning the entire journey to the last click.
Where are local customers leaking out of your plumbing funnel?
We can audit the search visibility, reputation, service pages, mobile contact paths, and tracking between first discovery and a booked plumbing job.
Run My Free SEO Leak Check