
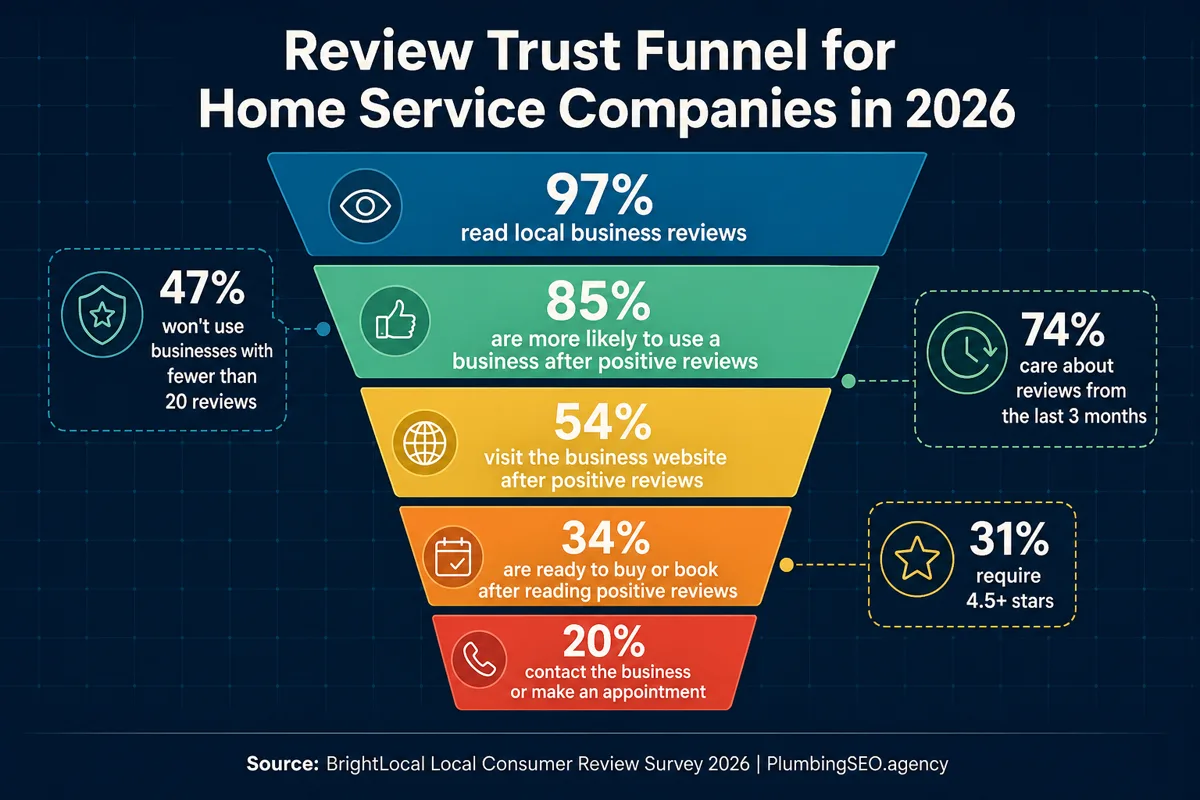
- Reviews are now a trust gate. BrightLocal reports 97% of consumers read local business reviews, and 47% avoid businesses with fewer than 20 reviews.
- Freshness and response behavior matter. Consumers want recent reviews, high star ratings, and signs that the owner is paying attention.
- For plumbers and home service companies, reviews work best when they point to a strong website, clear next step, and fast follow-up.
Reviews are not decoration anymore. For a plumber, HVAC shop, electrician, roofer, or other home service company, they are proof that a stranger can trust you before they let you into the house.
The numbers below show the same thing from several angles. Customers are checking more places, expecting fresher reviews, demanding better star ratings, and watching how you respond when something goes wrong. If the phones feel quieter than they should, your review profile may be where calls are leaking away.
- BrightLocal reports that 97% of consumers read reviews for local businesses. That means reviews are part of the dispatch path, not a side project.
- Review recency is now a real trust filter. BrightLocal found 74% of consumers care about reviews from the last three months.
- Review count matters before the call. In BrightLocal’s 2026 survey, 47% of consumers would not use a business with fewer than 20 reviews.
- Star expectations are rising. BrightLocal found 31% of consumers now require 4.5+ stars, up from 17% the prior year.
- Reviews push people toward your website. BrightLocal found 54% visit the business website after reading positive reviews.
- Housecall Pro found 96% of homeowners expect a user-friendly professional website, so reviews and website quality need to line up.
- Capital One Shopping reports 75% of shoppers are concerned about fake reviews. A clean, steady, policy-safe review process matters.
- The FTC finalized a rule banning fake reviews and testimonials, giving honest contractors one more reason to avoid shortcuts.
1. Trust and discovery benchmarks
For a homeowner, reviews reduce risk. They want to know whether your crew shows up, communicates, protects the house, explains the bill, and fixes the problem without a second mess. That is why review behavior keeps spreading across Google, Facebook, AI answers, video, directories, and niche sites.
| Benchmark | Value | Source | Year |
|---|---|---|---|
| Consumers read reviews for local businesses | 97% | BrightLocal | 2026 |
| Consumers always read reviews when browsing for businesses | 41% | BrightLocal | 2026 |
| Consumers always read reviews in the prior year baseline | 29% | BrightLocal | 2025 |
| Average number of review sites consumers use when choosing a business | 6 sites | BrightLocal | 2026 |
| Google usage for local reviews and recommendations | 71% | BrightLocal | 2026 |
| Google usage for local reviews and recommendations in the prior year | 83% | BrightLocal | 2025 |
| ChatGPT and other AI tools used for local recommendations | 45% | BrightLocal | 2026 |
| AI tool usage for local recommendations in the prior year | 6% | BrightLocal | 2025 |
| Apple Maps usage for local recommendations | 27% | BrightLocal | 2026 |
| Apple Maps usage in the prior year | 14% | BrightLocal | 2025 |
| Local news site usage for local recommendations | 29% | BrightLocal | 2026 |
| Local news site usage in the prior year | 48% | BrightLocal | 2025 |
| Consumers who will not use a business with fewer than 20 reviews | 47% | BrightLocal | 2026 |
| Consumers willing to use a business with five or fewer reviews | 9% | BrightLocal | 2026 |
| Consumers who care about star ratings when choosing a business | 92% | BrightLocal | 2026 |
| Consumers who will only use businesses with 4.5 stars or more | 31% | BrightLocal | 2026 |
| Consumers requiring 4.5 stars or more in the prior year | 17% | BrightLocal | 2025 |
| Consumers who will only use businesses with four or more stars | 68% | BrightLocal | 2026 |
| Consumers requiring four or more stars in the prior year | 55% | BrightLocal | 2025 |
| Consumers requiring a perfect five-star rating | 10% | BrightLocal | 2026 |
| Consumers who only care about reviews from the last three months | 74% | BrightLocal | 2026 |
| Consumers only swayed by reviews from the last week | 18% | BrightLocal | 2026 |
| Consumers looking for reviews from the last two weeks | 32% | BrightLocal | 2026 |
| Consumers looking for reviews from the last two weeks in the prior year | 20% | BrightLocal | 2025 |
| Consumers who say review positivity is an important factor | 46% | BrightLocal | 2026 |
| Consumers who say review recency within the last month is important | 44% | BrightLocal | 2026 |
| Consumers who say high star rating is important | 42% | BrightLocal | 2026 |
| Consumers who say owner response is important | 37% | BrightLocal | 2026 |
The practical point is simple. Google reviews still matter most, but they are no longer the only reputation surface. If your website, profiles, photos, service-area pages, and business listings disagree with each other, customers see friction before they ever call.
2. Star rating, recency, and review count benchmarks
A plumbing company does not need to look perfect. In fact, too perfect can look suspicious. But it does need a review profile that looks active, current, and consistent. A few old five-star reviews from three years ago will not carry the same trust as steady recent feedback from real jobs.
In my opinion, the review-count benchmark is the one new operators underestimate. The first 20 reviews are not about vanity. They are the minimum proof a nervous homeowner wants before choosing a company they have never used.
3. Home service hiring and conversion benchmarks
For home service work, reviews do not close the job by themselves. They move the homeowner to the next proof point. That next step may be your website, your online booking flow, your photos, your pricing clarity, or your follow-up process.
| Benchmark | Value | Source | Year |
|---|---|---|---|
| Consumers more likely to use a business after positive reviews | 85% | BrightLocal | 2026 |
| Consumers deterred by negative reviews | 77% | BrightLocal | 2026 |
| Consumers who do further research after positive reviews | 66% | BrightLocal | 2026 |
| Consumers ready to buy or book after positive reviews | 34% | BrightLocal | 2026 |
| Consumers who visit a business website after positive reviews | 54% | BrightLocal | 2026 |
| Consumers who visited a business website after positive reviews in 2019 | 32% | BrightLocal | 2019 |
| Consumers who read more reviews after positive reviews | 37% | BrightLocal | 2026 |
| Consumers who visit social media after positive reviews | 24% | BrightLocal | 2026 |
| Consumers who visit the business location after positive reviews | 31% | BrightLocal | 2026 |
| Consumers who contact the business after positive reviews | 20% | BrightLocal | 2026 |
| Consumers who make an appointment after positive reviews | 20% | BrightLocal | 2026 |
| Consumers who made a purchase after reading reviews | 93% | BrightLocal | 2026 |
| Consumers who spent over $1,000 after reading reviews | 27% | BrightLocal | 2026 |
| Consumers who spent over $5,000 after reading reviews | 13% | BrightLocal | 2026 |
| Consumers who regretted a purchase after reading reviews | 70% | BrightLocal | 2026 |
| Consumers who regretted spending over $1,000 after reading reviews | 14% | BrightLocal | 2026 |
| Consumers who regretted spending over $10,000 after reading reviews | 2% | BrightLocal | 2026 |
| Consumers who trust reviews as much as personal recommendations | 49% | BrightLocal | 2026 |
| Homeowners surveyed in Housecall Pro customer-service report | 1,040 | Housecall Pro | 2025 |
| Homeowners who would pay more for a pro with a better service reputation | Over 70% | Housecall Pro | 2025 |
| Homeowners who would refer a pro after an excellent experience | 73% | Housecall Pro | 2025 |
| Homeowners who factor online booking into choosing a pro | 80% | Housecall Pro | 2025 |
| Homeowners who expect a user-friendly, professional website | 96% | Housecall Pro | 2025 |
| Homeowners who appreciate seeing a technician name and photo before the visit | Nearly 60% | Housecall Pro | 2025 |
| Homeowners comfortable with AI handling initial inquiries | 53% | Housecall Pro | 2025 |
| Homeowners expecting photo or video proof after every job | 68% | Housecall Pro | 2025 |
| Homeowners who say photo or video proof would be nice to receive | 28% | Housecall Pro | 2025 |
| Homeowners who would hire the same company again after strong service | 68% | Housecall Pro | 2025 |
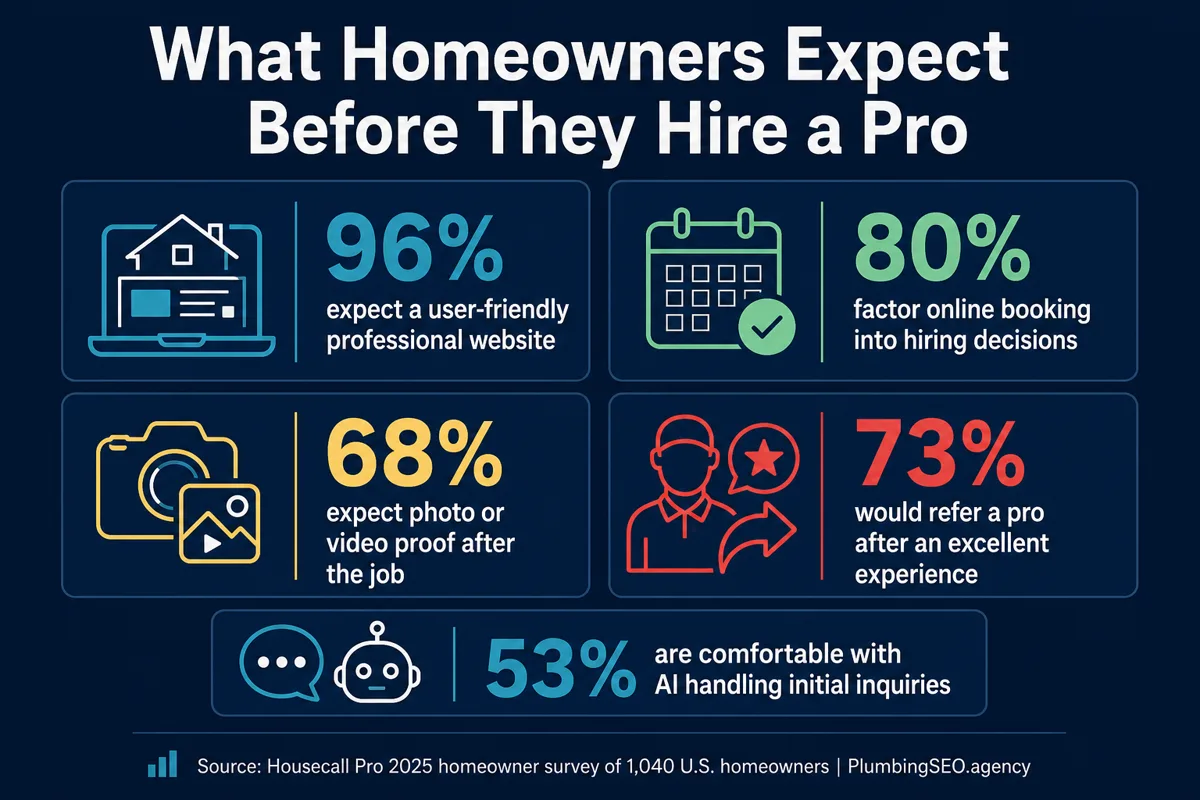
The owner-side takeaway is that review work and website work have to happen together. If positive reviews send a homeowner to a slow, thin, confusing site, the trust you earned on Google can leak out before the form fill or phone call.
If you are using reviews to support local ranking work, pair this article with our plumber SEO homepage and our plumber-specific plumbing SEO statistics roundup.
What to fix first if your reviews are not turning into booked jobs
- Ask every satisfied customer while the job is still fresh. Waiting a week makes a simple request feel like homework.
- Respond to good and bad reviews like a real owner. Short, specific, and calm beats canned copy.
- Put review proof near the service pages that drive calls. A drain-cleaning visitor should see proof about drain work, not only a generic testimonial.
- Make the next step obvious. Phone, text, estimate request, and service-area links should be easy to find.
- Use photos and job notes to support the review story. Housecall Pro’s survey shows homeowners care about proof, not just promises.
4. Responses, fake reviews, and risk benchmarks
Reputation management is not just collecting praise. It is how the company handles friction in public. A calm response to a rough review can show future customers that you are accountable. A missing response can make them wonder who is minding the shop.
| Benchmark | Value | Source | Year |
|---|---|---|---|
| American consumers who read online reviews before purchases | More than 99% | Capital One Shopping | 2026 |
| Consumers whose purchasing decisions are influenced by reviews | 93% | Capital One Shopping | 2026 |
| Shoppers who begin consumer research with Google reviews | 71% | Capital One Shopping | 2026 |
| Average number of reviews consumers read before trusting a business | 10 reviews | Capital One Shopping | 2026 |
| Consumers concerned about fake reviews | 75% | Capital One Shopping | 2026 |
| Consumers who trust mixed reviews more than all five-star reviews | 76% | Capital One Shopping | 2026 |
| Consumers frequently influenced by online reviews | 66% | Capital One Shopping | 2026 |
| Consumers hesitant to consider a product without online reviews | 85% | Capital One Shopping | 2026 |
| American consumers who trust crowd-sourced review websites | 54% | Capital One Shopping | 2026 |
| U.S. consumers undecided on whether they trust online reviews | 24% | Capital One Shopping | 2026 |
| Consumers who find online customer reviews very helpful | 49% | Capital One Shopping | 2026 |
| Consumers who rarely visit unfamiliar businesses without reviews | 70% | Capital One Shopping | 2026 |
| Sales lift associated with displaying customer reviews | 19.8% | Capital One Shopping | 2026 |
| Conversion lift from verified-buyer reviews | 15% | Capital One Shopping | 2026 |
| Conversion lift when retailers display five or more reviews | 270% | Capital One Shopping | 2026 |
| Luxury-product conversion lift from displaying reviews | 380% | Capital One Shopping | 2026 |
| Low-priced product conversion lift from displaying reviews | 190% | Capital One Shopping | 2026 |
| Consumers spending time reading reviews before trusting a local business | 13 min 45 sec | Capital One Shopping | 2026 |
| Consumers whose decisions are influenced by number of reviews | 85% | Capital One Shopping | 2026 |
| Consumers who regularly read reviews for local businesses | 71% | Capital One Shopping | 2026 |
| Consumers referring to at least two review sites before purchase decisions | 74% | Capital One Shopping | 2026 |
| Consumers prompted by a local business to leave a review | 78% | Capital One Shopping | 2026 |
There is also a compliance side. The Federal Trade Commission’s final rule on fake reviews and testimonials prohibits buying, selling, or manipulating reviews in several ways. For a real service company, the safest long-term play is boring and reliable. Do good work, ask consistently, respond professionally, and do not touch fake-review schemes with a ten-foot pipe wrench.
| Benchmark | Value | Source | Year |
|---|---|---|---|
| Customers who left reviews after being prompted by the business | 65% | Capital One Shopping | 2026 |
| People likely to leave a review when requested by email | 40% | Capital One Shopping | 2026 |
| People likely to leave a review when requested in person | 27% | Capital One Shopping | 2026 |
| Consumers who never write online reviews | 6% | Capital One Shopping | 2026 |
| Consumers against AI-generated reviews | 88% | Capital One Shopping | 2026 |
| Consumers preferring review platforms with multiple reviews over individual social opinions | 88% | Capital One Shopping | 2026 |
| Consumers expecting reviews within one month | 44% | Capital One Shopping | 2026 |
| Consumers expecting reviews within three months | 77% | Capital One Shopping | 2026 |
| Consumers likely to choose a business that replies to all reviews | 80% | Capital One Shopping | 2026 |
| Consumers believing businesses should respond to customer reviews within one week | 81% | Capital One Shopping | 2026 |
5. Summary table: 79+ online review statistics for home service companies
Use this table as a planning checklist. The goal is not to chase every number. The goal is to know which trust signals affect a homeowner before they call, book, or move on to another contractor.
| # | Statistic | Value | Source | Year |
|---|---|---|---|---|
| 1 | Consumers read reviews for local businesses | 97% | BrightLocal | 2026 |
| 2 | Consumers always read reviews when browsing for businesses | 41% | BrightLocal | 2026 |
| 3 | Consumers always read reviews in the prior year baseline | 29% | BrightLocal | 2025 |
| 4 | Average number of review sites consumers use when choosing a business | 6 sites | BrightLocal | 2026 |
| 5 | Google usage for local reviews and recommendations | 71% | BrightLocal | 2026 |
| 6 | Google usage for local reviews and recommendations in the prior year | 83% | BrightLocal | 2025 |
| 7 | ChatGPT and other AI tools used for local recommendations | 45% | BrightLocal | 2026 |
| 8 | AI tool usage for local recommendations in the prior year | 6% | BrightLocal | 2025 |
| 9 | Apple Maps usage for local recommendations | 27% | BrightLocal | 2026 |
| 10 | Apple Maps usage in the prior year | 14% | BrightLocal | 2025 |
| 11 | Local news site usage for local recommendations | 29% | BrightLocal | 2026 |
| 12 | Local news site usage in the prior year | 48% | BrightLocal | 2025 |
| 13 | Consumers who will not use a business with fewer than 20 reviews | 47% | BrightLocal | 2026 |
| 14 | Consumers willing to use a business with five or fewer reviews | 9% | BrightLocal | 2026 |
| 15 | Consumers who care about star ratings when choosing a business | 92% | BrightLocal | 2026 |
| 16 | Consumers who will only use businesses with 4.5 stars or more | 31% | BrightLocal | 2026 |
| 17 | Consumers requiring 4.5 stars or more in the prior year | 17% | BrightLocal | 2025 |
| 18 | Consumers who will only use businesses with four or more stars | 68% | BrightLocal | 2026 |
| 19 | Consumers requiring four or more stars in the prior year | 55% | BrightLocal | 2025 |
| 20 | Consumers requiring a perfect five-star rating | 10% | BrightLocal | 2026 |
| 21 | Consumers who only care about reviews from the last three months | 74% | BrightLocal | 2026 |
| 22 | Consumers only swayed by reviews from the last week | 18% | BrightLocal | 2026 |
| 23 | Consumers looking for reviews from the last two weeks | 32% | BrightLocal | 2026 |
| 24 | Consumers looking for reviews from the last two weeks in the prior year | 20% | BrightLocal | 2025 |
| 25 | Consumers who say review positivity is an important factor | 46% | BrightLocal | 2026 |
| 26 | Consumers who say review recency within the last month is important | 44% | BrightLocal | 2026 |
| 27 | Consumers who say high star rating is important | 42% | BrightLocal | 2026 |
| 28 | Consumers who say owner response is important | 37% | BrightLocal | 2026 |
| 29 | Consumers more likely to use a business after positive reviews | 85% | BrightLocal | 2026 |
| 30 | Consumers deterred by negative reviews | 77% | BrightLocal | 2026 |
| 31 | Consumers who do further research after positive reviews | 66% | BrightLocal | 2026 |
| 32 | Consumers ready to buy or book after positive reviews | 34% | BrightLocal | 2026 |
| 33 | Consumers who visit a business website after positive reviews | 54% | BrightLocal | 2026 |
| 34 | Consumers who visited a business website after positive reviews in 2019 | 32% | BrightLocal | 2019 |
| 35 | Consumers who read more reviews after positive reviews | 37% | BrightLocal | 2026 |
| 36 | Consumers who visit social media after positive reviews | 24% | BrightLocal | 2026 |
| 37 | Consumers who visit the business location after positive reviews | 31% | BrightLocal | 2026 |
| 38 | Consumers who contact the business after positive reviews | 20% | BrightLocal | 2026 |
| 39 | Consumers who make an appointment after positive reviews | 20% | BrightLocal | 2026 |
| 40 | Consumers who made a purchase after reading reviews | 93% | BrightLocal | 2026 |
| 41 | Consumers who spent over $1,000 after reading reviews | 27% | BrightLocal | 2026 |
| 42 | Consumers who spent over $5,000 after reading reviews | 13% | BrightLocal | 2026 |
| 43 | Consumers who regretted a purchase after reading reviews | 70% | BrightLocal | 2026 |
| 44 | Consumers who regretted spending over $1,000 after reading reviews | 14% | BrightLocal | 2026 |
| 45 | Consumers who regretted spending over $10,000 after reading reviews | 2% | BrightLocal | 2026 |
| 46 | Consumers who trust reviews as much as personal recommendations | 49% | BrightLocal | 2026 |
| 47 | Homeowners surveyed in Housecall Pro customer-service report | 1,040 | Housecall Pro | 2025 |
| 48 | Homeowners who would pay more for a pro with a better service reputation | Over 70% | Housecall Pro | 2025 |
| 49 | Homeowners who would refer a pro after an excellent experience | 73% | Housecall Pro | 2025 |
| 50 | Homeowners who factor online booking into choosing a pro | 80% | Housecall Pro | 2025 |
| 51 | Homeowners who expect a user-friendly, professional website | 96% | Housecall Pro | 2025 |
| 52 | Homeowners who appreciate seeing a technician name and photo before the visit | Nearly 60% | Housecall Pro | 2025 |
| 53 | Homeowners comfortable with AI handling initial inquiries | 53% | Housecall Pro | 2025 |
| 54 | Homeowners expecting photo or video proof after every job | 68% | Housecall Pro | 2025 |
| 55 | Homeowners who say photo or video proof would be nice to receive | 28% | Housecall Pro | 2025 |
| 56 | Homeowners who would hire the same company again after strong service | 68% | Housecall Pro | 2025 |
| 57 | American consumers who read online reviews before purchases | More than 99% | Capital One Shopping | 2026 |
| 58 | Consumers whose purchasing decisions are influenced by reviews | 93% | Capital One Shopping | 2026 |
| 59 | Shoppers who begin consumer research with Google reviews | 71% | Capital One Shopping | 2026 |
| 60 | Average number of reviews consumers read before trusting a business | 10 reviews | Capital One Shopping | 2026 |
| 61 | Consumers concerned about fake reviews | 75% | Capital One Shopping | 2026 |
| 62 | Consumers who trust mixed reviews more than all five-star reviews | 76% | Capital One Shopping | 2026 |
| 63 | Consumers frequently influenced by online reviews | 66% | Capital One Shopping | 2026 |
| 64 | Consumers hesitant to consider a product without online reviews | 85% | Capital One Shopping | 2026 |
| 65 | American consumers who trust crowd-sourced review websites | 54% | Capital One Shopping | 2026 |
| 66 | U.S. consumers undecided on whether they trust online reviews | 24% | Capital One Shopping | 2026 |
| 67 | Consumers who find online customer reviews very helpful | 49% | Capital One Shopping | 2026 |
| 68 | Consumers who rarely visit unfamiliar businesses without reviews | 70% | Capital One Shopping | 2026 |
| 69 | Sales lift associated with displaying customer reviews | 19.8% | Capital One Shopping | 2026 |
| 70 | Conversion lift from verified-buyer reviews | 15% | Capital One Shopping | 2026 |
| 71 | Conversion lift when retailers display five or more reviews | 270% | Capital One Shopping | 2026 |
| 72 | Luxury-product conversion lift from displaying reviews | 380% | Capital One Shopping | 2026 |
| 73 | Low-priced product conversion lift from displaying reviews | 190% | Capital One Shopping | 2026 |
| 74 | Consumers spending time reading reviews before trusting a local business | 13 min 45 sec | Capital One Shopping | 2026 |
| 75 | Consumers whose decisions are influenced by number of reviews | 85% | Capital One Shopping | 2026 |
| 76 | Consumers who regularly read reviews for local businesses | 71% | Capital One Shopping | 2026 |
| 77 | Consumers referring to at least two review sites before purchase decisions | 74% | Capital One Shopping | 2026 |
| 78 | Consumers prompted by a local business to leave a review | 78% | Capital One Shopping | 2026 |
| 79 | Customers who left reviews after being prompted by the business | 65% | Capital One Shopping | 2026 |
| 80 | People likely to leave a review when requested by email | 40% | Capital One Shopping | 2026 |
| 81 | People likely to leave a review when requested in person | 27% | Capital One Shopping | 2026 |
| 82 | Consumers who never write online reviews | 6% | Capital One Shopping | 2026 |
| 83 | Consumers against AI-generated reviews | 88% | Capital One Shopping | 2026 |
| 84 | Consumers preferring review platforms with multiple reviews over individual social opinions | 88% | Capital One Shopping | 2026 |
| 85 | Consumers expecting reviews within one month | 44% | Capital One Shopping | 2026 |
| 86 | Consumers expecting reviews within three months | 77% | Capital One Shopping | 2026 |
| 87 | Consumers likely to choose a business that replies to all reviews | 80% | Capital One Shopping | 2026 |
| 88 | Consumers believing businesses should respond to customer reviews within one week | 81% | Capital One Shopping | 2026 |
6. Methodology and source notes
This roundup uses source-cited statistics from BrightLocal, Housecall Pro, Capital One Shopping, LocaliQ, and the Federal Trade Commission. Statistics were grouped by how a home service owner can use them: trust, discovery, review quality, conversion, response behavior, and fake-review risk.
Some sources are broad consumer or retail datasets rather than plumbing-only datasets. When that is the case, the article applies the statistic conservatively to home service decisions where the trust problem is similar or stronger. Letting a contractor into the house is a higher-trust decision than buying a sweater. The phone tells the truth.
For plumber-specific local search context, read the companion local SEO for plumbers statistics guide.
Frequently Asked Questions
The most useful benchmarks are that 97% of consumers read local business reviews, 47% will not use a business with fewer than 20 reviews, 74% care about reviews from the last three months, and 85% are more likely to use a business after positive reviews. For home service companies, those numbers point to a simple operating plan: ask consistently, keep reviews recent, respond quickly, and make sure the website backs up the trust earned by reviews.
A practical minimum target is 20 reviews per major profile because BrightLocal found 47% of consumers will not use a business with fewer than 20 reviews. After that, the goal should shift from a one-time review count to steady review velocity. A company with fresh monthly reviews usually looks more active and trustworthy than a company with a big but stale review pile.
Both matter. BrightLocal found 92% of consumers care about star ratings, while 47% will not use a business with fewer than 20 reviews. A 4.8 rating with three reviews may look unproven, while 200 reviews at 4.6 can look more reliable. Homeowners want enough reviews to see a pattern and enough rating quality to feel safe.
Yes, if they can do it naturally and professionally. Capital One Shopping reports that 80% of consumers are likely to choose a business that replies to all reviews, and LocaliQ reports that review readers also read responses. Responses should be short, specific, and calm. Do not argue with customers in public.
No. Fake reviews can damage trust, trigger platform penalties, and create legal risk. The FTC finalized a rule banning fake reviews and testimonials, and Capital One Shopping reports that 83% of review readers avoid a business after discovering fake or compensated reviews. Real reviews from real customers are slower, but they are safer and stronger.
Connect reviews to the rest of the buying path. Ask satisfied customers for reviews, respond to feedback, add review proof on service pages, keep photos and job examples current, and make the phone or booking step obvious. Reviews create trust, but the website, pricing clarity, and response speed help turn that trust into a booked job.
Want your reviews to turn into more booked plumbing jobs?
We will look at your Google Business Profile, review velocity, service pages, and local search visibility, then show you where trust is leaking before the phone call.
Request a Plumbing SEO Review