
- Repeat intent is not the same as retention: 68% of homeowners in one home-service survey said they would hire the same company again. Your CRM must show how many actually did.
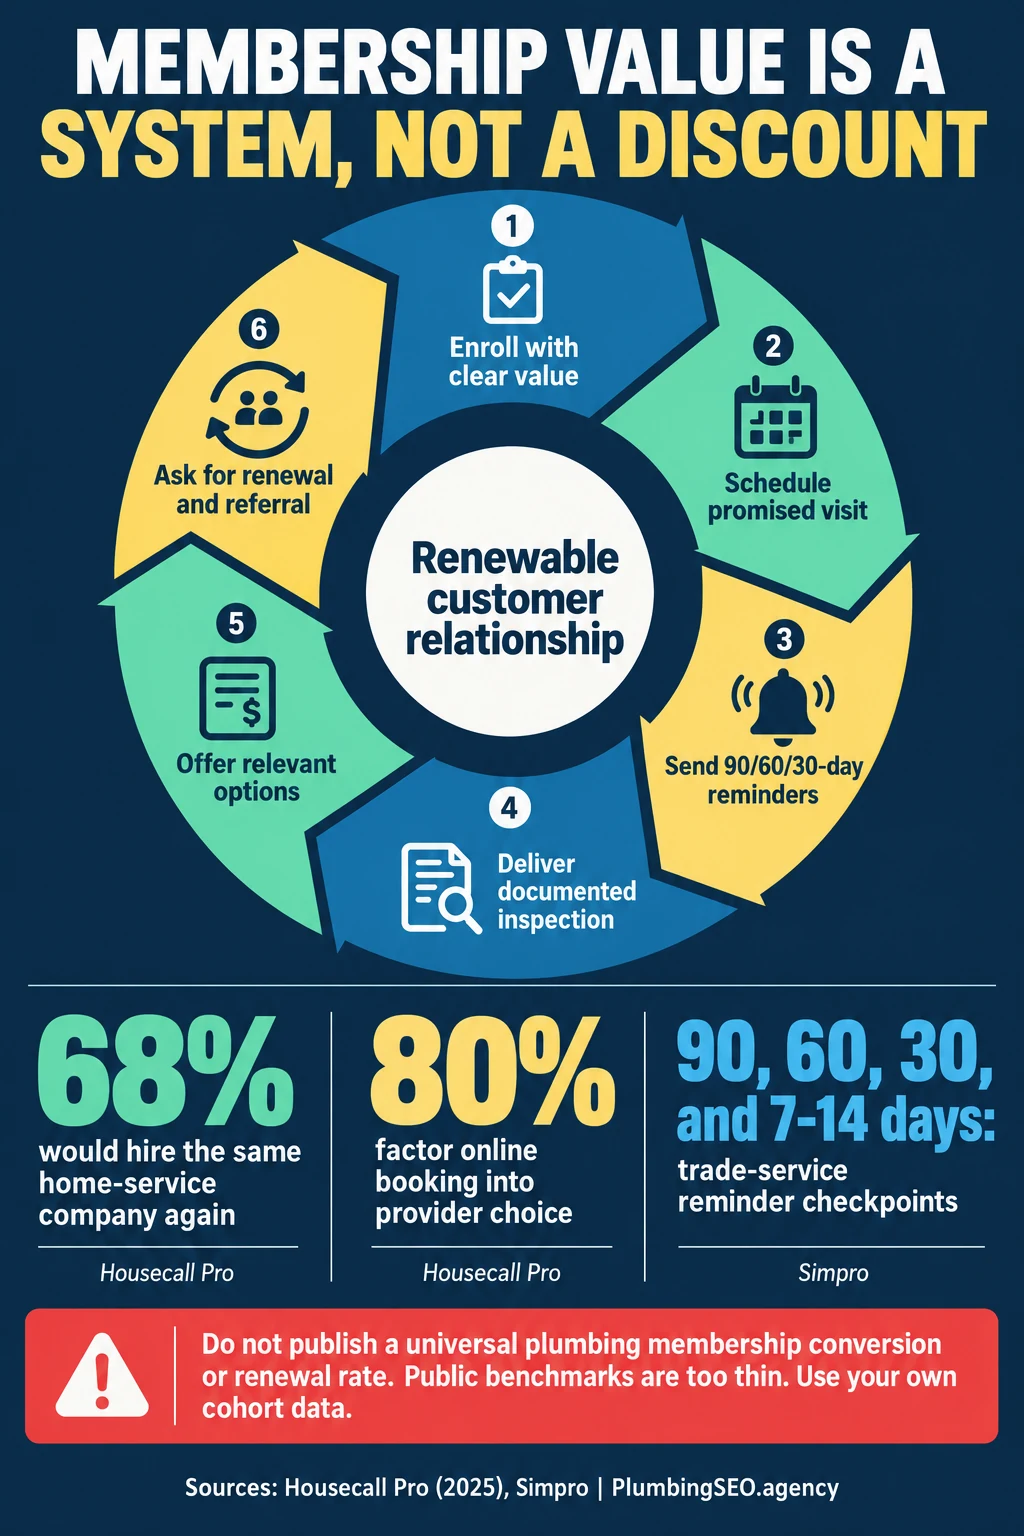
- Ease affects loyalty: 80% factored online booking into provider choice, while millennials were more than three times as likely as boomers to rehire based on ease.
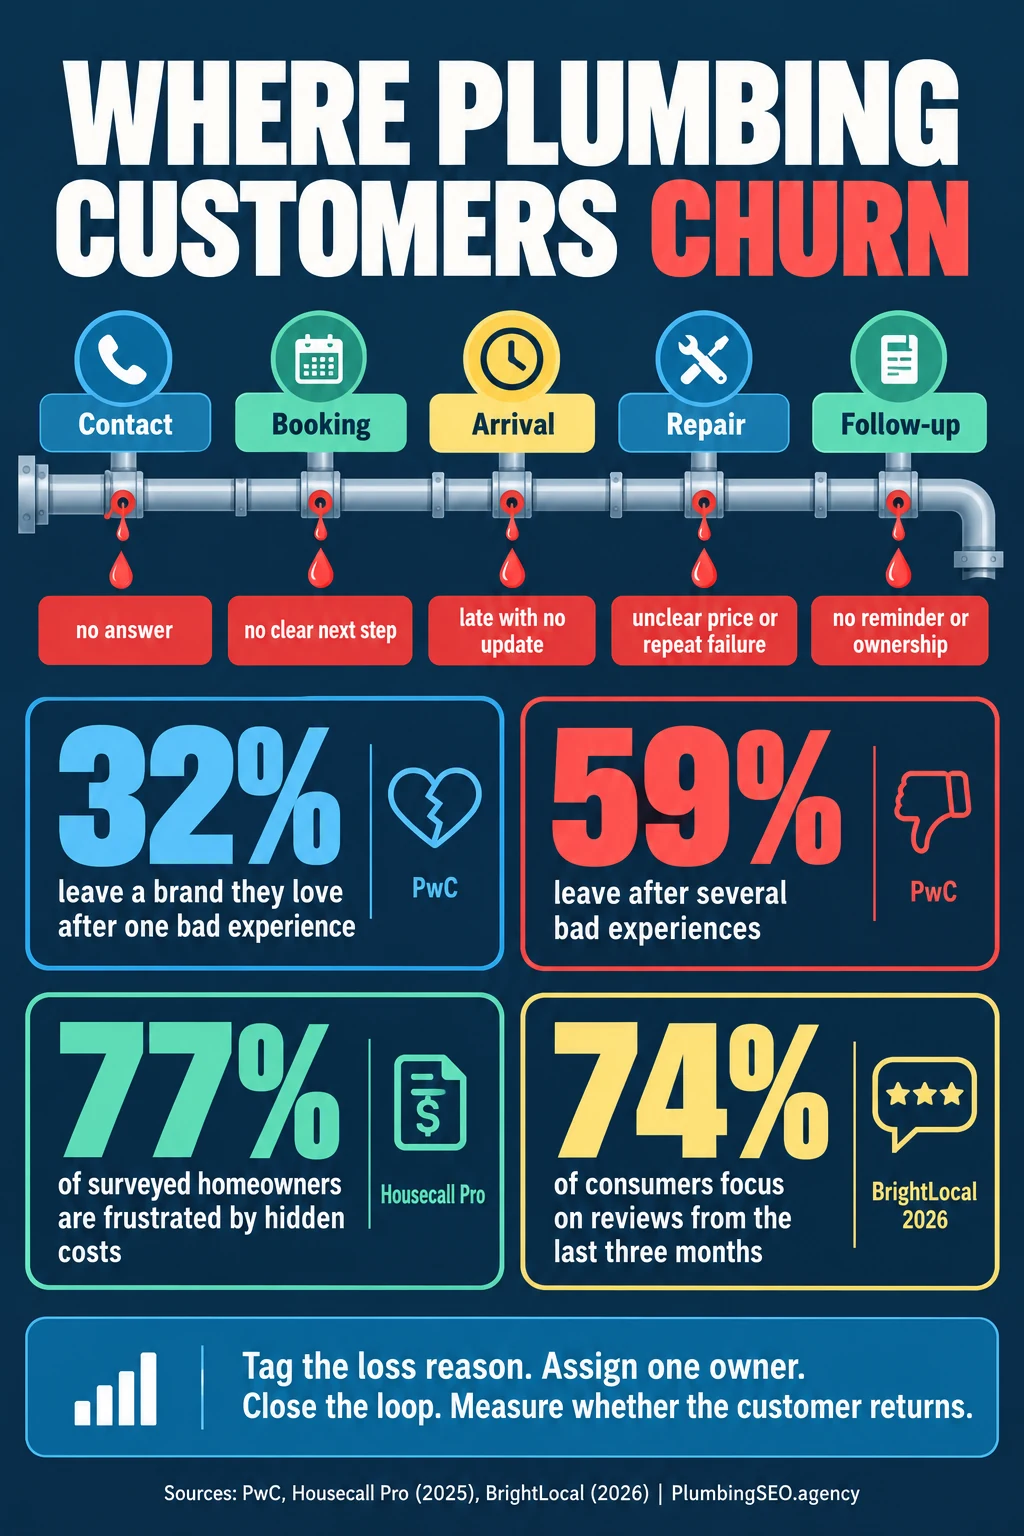
- A bad experience can erase preference: PwC found 32% would leave a brand they loved after one bad experience; 59% would leave after several.
- Memberships need cohort math: public plumbing renewal benchmarks are thin. Track enrollment, fulfilled visits, renewal eligibility, renewal, cancellation reason, gross profit, and referred jobs by start month.
- External statistics are guardrails: do not turn cross-industry loyalty, retail, or software data into a promised plumbing result.
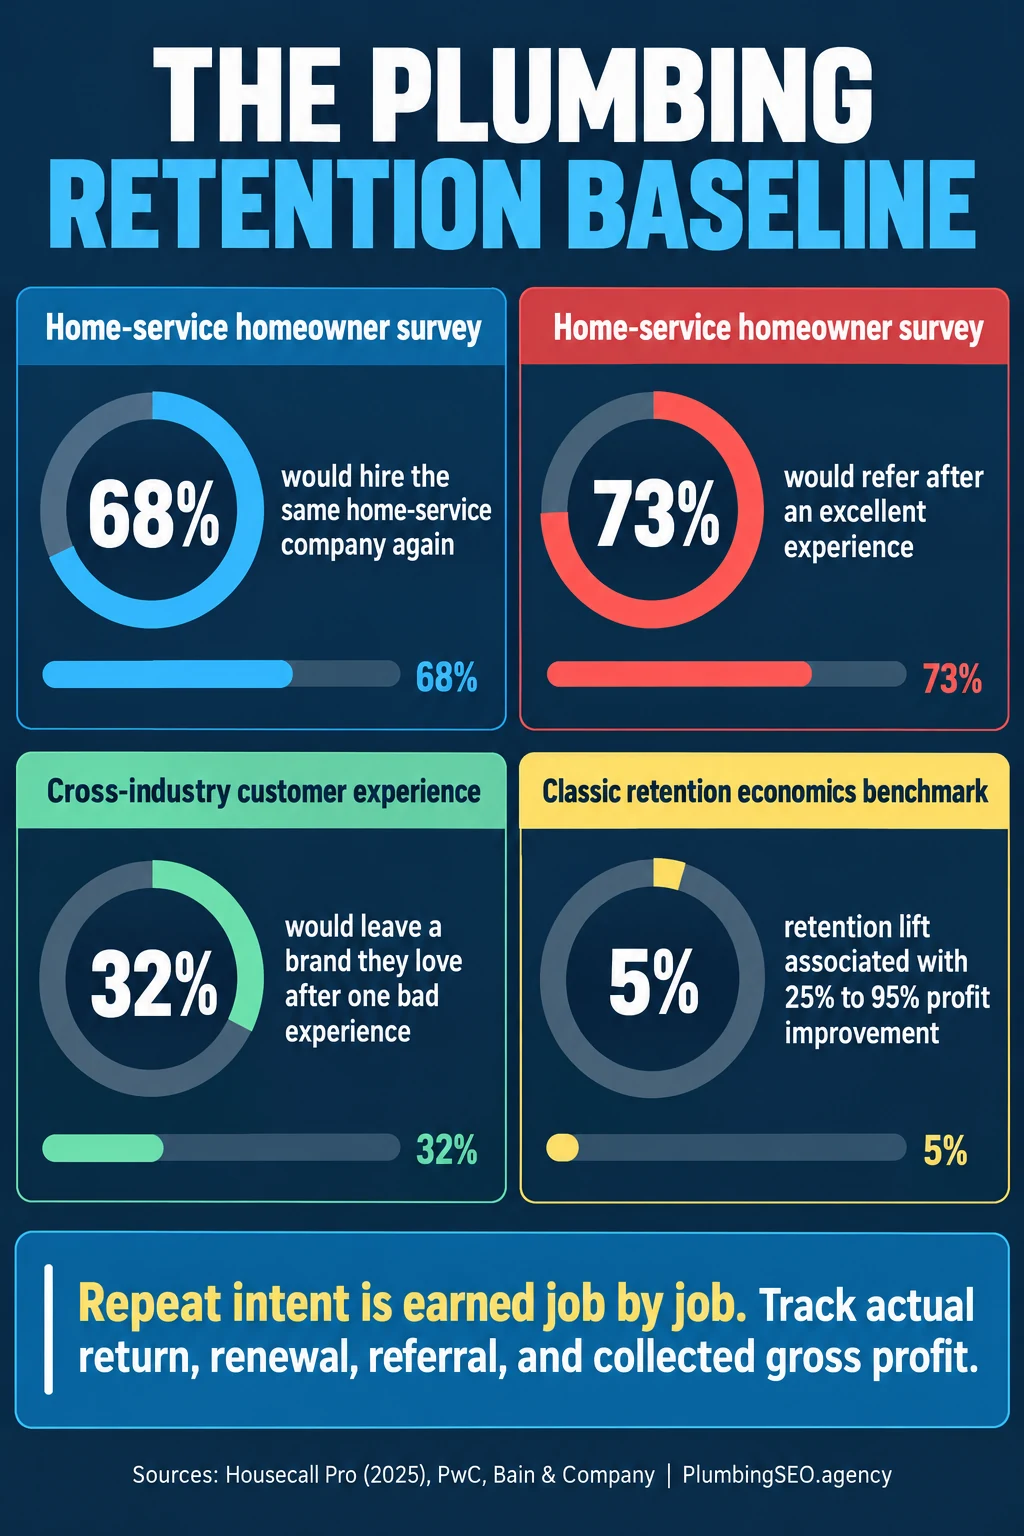
A plumbing company can buy the first click, answer the first call, and complete the first repair without building a repeat customer. Retention starts when the customer can identify the company later, trusts the previous outcome, receives a relevant reminder, and can book the next job without friction.
This report compiles 75 numbered customer-retention statistics from home-service research, customer-experience surveys, loyalty studies, review research, call datasets, email benchmarks, and mobile-usage data. Direct plumbing-only retention research is scarce. Every table therefore labels scope, and the article separates survey intent from observed behavior.
For benchmarks focused on the service interaction itself, see the related plumbing customer service statistics. This page goes further downstream: repeat jobs, maintenance relationships, renewal, reactivation, referrals, churn, and customer lifetime value.
1. Repeat-hire intent and homeowner loyalty statistics
Housecall Pro surveyed 1,040 U.S. homeowner decision-makers in 2025. These are stated preferences, not observed plumbing retention rates, but they show which parts of the home-service experience influence a future choice.
| # | Home-service loyalty benchmark | Value | Source | Retention interpretation |
|---|---|---|---|---|
| 1 | Homeowner decision-makers surveyed | 1,040 | Housecall Pro, 2025 | Survey sample, not plumbing CRM data |
| 2 | Homeowners willing to pay more for a pro with a better service reputation | Over 70% | Housecall Pro | Reputation can support value |
| 3 | Homeowners willing to refer a pro after an excellent experience | 73% | Housecall Pro | Referral intent |
| 4 | Homeowners saying they would hire the same company again | 68% | Housecall Pro | Repeat-hire intent |
| 5 | Millennials' likelihood versus boomers to rehire based on ease | Over 3× | Housecall Pro | Convenience matters unevenly by age |
| 6 | Homeowners who value useful tips from technicians | 70% | Housecall Pro | Education can extend the relationship |
| 7 | Homeowners expecting photo or video proof after work | 68% | Housecall Pro | Documented completion supports trust |
| 8 | Homeowners influenced by visuals of past work | 92% | Housecall Pro | Proof affects selection and recall |
Owner takeaway: create a recognizable closeout: explain what was repaired, document it, save the equipment and service details, state what should be watched, and tell the customer how to reach the company. Then measure the eventual return instead of treating stated satisfaction as proof of retention.
2. Retention economics and customer lifetime value statistics
The best-known retention economics come from cross-industry studies, not plumbing companies. They are useful for explaining why repeat work deserves management attention, but they are not a calculator. Plumbing lifetime value varies with service mix, household tenure, geography, plan economics, gross margin, and the period used.
| # | Retention-economics benchmark | Value | Source | Scope |
|---|---|---|---|---|
| 9 | Retention increase used in Bain's frequently cited model | 5% | Bain & Company | Classic cross-industry analysis |
| 10 | Profit increase associated with that retention improvement | 25%–95% | Bain & Company | Range, not a plumbing forecast |
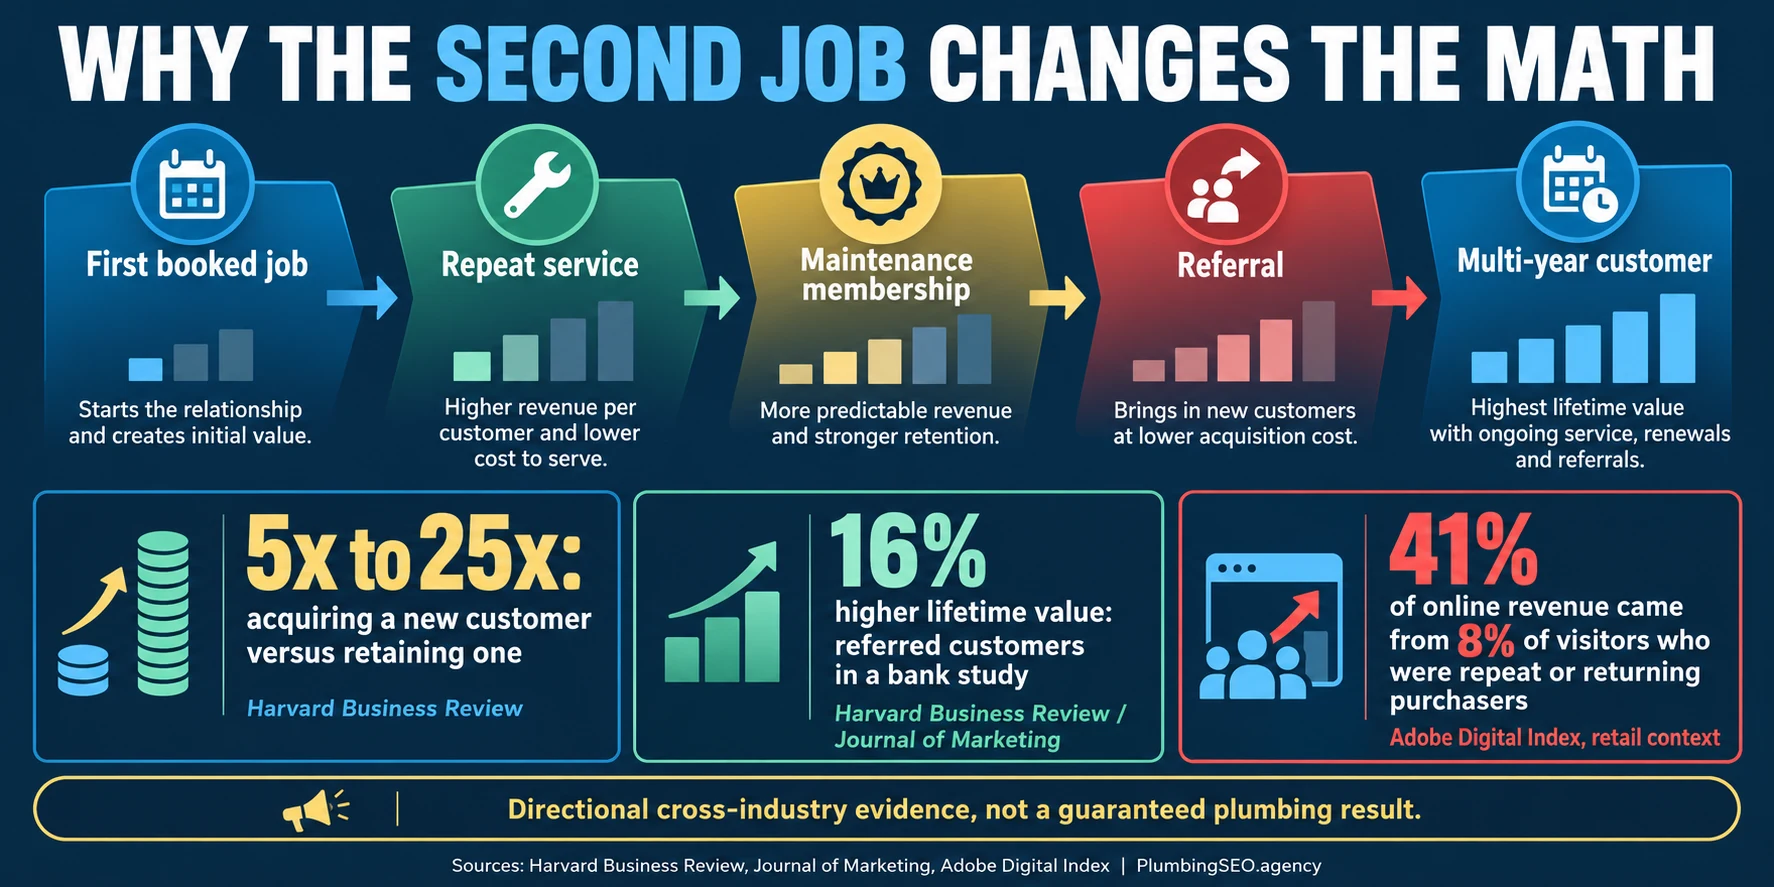
| 11 | Frequently cited acquisition cost relative to retention cost | 5×–25× | Harvard Business Review | Cross-industry framing |
| 12 | Higher lifetime value observed for referred bank customers | 16% | HBR / Journal of Marketing | German bank study |
| 13 | Online visitors classified as returning or repeat purchasers | 8% | Adobe Digital Index | Online retail, not home services |
| 14 | Online revenue attributed to that 8% visitor group | 41% | Adobe Digital Index | Retail revenue concentration |
| 15 | Visitors classified as repeat purchasers | 1% | Adobe Digital Index | Retail visitor segment |
| 16 | Online revenue attributed to repeat purchasers | 23% | Adobe Digital Index | Retail context only |
Simple historical LTV
Total gross profit from cohort ÷ unique customers in cohortUse actual collected revenue and direct job costs. Do not substitute booked revenue.
Planning LTV
Average gross profit/job × jobs/year × retained yearsShow low, base, and high cases. Validate each assumption against customer history.
Connect source, customer, invoice, and gross profit with a plumbing lead CRM. Otherwise, a high average ticket can hide low repeat behavior, and a large customer file can hide dormant households.
3. Maintenance membership and loyalty-program statistics
There is no defensible public “average plumbing membership renewal rate” that applies across markets, plan designs, dispatch capacity, prices, and eligibility rules. The closest broad evidence comes from loyalty-program research and homeowner expectations. It shows why clear value and convenience matter—not what your renewal rate should be.
| # | Membership or loyalty benchmark | Value | Source | Plumbing interpretation |
|---|---|---|---|---|
| 17 | Paid-loyalty members more likely to spend more after subscribing | 60% | McKinsey | Consumer loyalty programs, not plumbing plans |
| 18 | Paid-loyalty members more likely to choose the brand over competitors | 59% | McKinsey | Selection preference |
| 19 | Paid-loyalty members more likely to make weekly purchases | 43% | McKinsey | Retail frequency; not a plumbing cadence |
| 20 | Annual revenue lift among customers redeeming in top-performing loyalty programs | 15%–25% | McKinsey | Top-program range, not universal |
| 21 | Homeowners factoring online booking into provider choice | 80% | Housecall Pro | Renewal experience should be easy |
| 22 | Homeowners frustrated by hidden costs | 77% | Housecall Pro | Disclose plan terms and exclusions |
| 23 | Homeowners expecting payment plans or financing options | 55% | Housecall Pro | Payment flexibility can affect retention |
| 24 | Homeowners saying instant estimates influence hiring | 93% | Housecall Pro | Clarity supports the next decision |
Owner takeaway: a membership is a promise to deliver future value. Measure whether visits happen, whether customers understand benefits, whether urgent access is honored, whether the plan creates profitable work, and whether members renew without avoidable friction.
4. Maintenance reminder and reactivation statistics
Reactivation should follow real service history: water-heater age, drain history, warranty timing, prior recommendation, membership due date, or an unsold estimate. Trade-service reminder guidance supplies a planning cadence; a home-service text-back study shows how quickly customers can respond when the message follows an existing contact attempt.
| # | Reminder or reactivation benchmark | Value | Source | Scope |
|---|---|---|---|---|
| 25 | Early service-reminder checkpoint | 90 days | Simpro | Trade-service guidance |
| 26 | Second service-reminder checkpoint | 60 days | Simpro | Trade-service guidance |
| 27 | Third service-reminder checkpoint | 30 days | Simpro | Trade-service guidance |
| 28 | Final pre-due reminder window | 7–14 days | Simpro | Trade-service guidance |
| 29 | Missed-call text messages analyzed | 14,354 | 99 Calls, 2026 | Home-service message sample |
| 30 | Home-service businesses represented | 192 | 99 Calls, 2026 | Multiple trades |
| 31 | Reply rate to missed-call text-back | 32.7% | 99 Calls, 2026 | Replies, not retained customers |
| 32 | Text-back replies arriving within five minutes | 74% | 99 Calls, 2026 | Among replies |
Build sequences around known events, stop them when a customer declines or books, and give replies to a named person. Compare channel performance in our plumbing email and SMS statistics.
5. Customer experience, churn, and service-recovery statistics
PwC's cross-industry research shows why a strong brand does not protect a plumbing company from repeated friction. Salesforce adds a more recent view of how service affects repurchase. Neither source measures plumbing churn directly, so use the data to define failure categories and escalation—not to forecast your loss rate.
| # | Experience or churn benchmark | Value | Source | Meaning |
|---|---|---|---|---|
| 33 | Consumers saying experience is an important buying factor | 73% | PwC | Experience shapes selection |
| 34 | Consumers who would leave a loved brand after one bad experience | 32% | PwC | Global result |
| 35 | Consumers who would leave after several bad experiences | 59% | PwC | Repeated friction compounds |
| 36 | U.S. consumers who would leave after one bad experience | 17% | PwC | U.S. subgroup |
| 37 | Consumers willing to pay more for greater convenience | 43% | PwC | Ease carries value |
| 38 | Consumers willing to pay more for a friendly, welcoming experience | 42% | PwC | Tone affects perceived value |
| 39 | Customers saying good service makes another purchase more likely | 94% | Salesforce | Cross-industry stated likelihood |
| 40 | Customers saying experience is as important as products or services | 88% | Salesforce | Cross-industry expectation |
6. Referral and customer-advocacy statistics
Referral is more than a lead source. It is evidence that a customer trusted the company enough to put a relationship at stake. The strongest figures below come from general consumer trust, home-service intent, and an observed bank referral program. Keep those scopes attached.
| # | Referral benchmark | Value | Source | Scope |
|---|---|---|---|---|
| 41 | Consumers trusting recommendations from people they know above other channels | 88% | Nielsen, 2021 | Global advertising trust |
| 42 | Homeowners willing to refer after an excellent home-service experience | 73% | Housecall Pro | Stated referral intent |
| 43 | Higher lifetime value observed among referred customers | 16% | HBR / Journal of Marketing | German bank study |
| 44 | Lower churn observed among referred customers | 18% | HBR / Journal of Marketing | German bank study |
| 45 | Consumers trusting reviews as much as personal recommendations | 49% | BrightLocal, 2026 | U.S. local consumers |
| 46 | Consumers more likely to use a business after positive reviews | 85% | BrightLocal, 2026 | Reported effect |
| 47 | Consumers ready to buy or book after positive reviews | 34% | BrightLocal, 2026 | High-intent subgroup |
Owner takeaway: ask after a clean closeout or confirmed recovery, not before the customer knows the outcome. Record the referring household, referred lead, booking, completed job, and gross profit. That reveals whether a program creates introductions or durable customers.
7. Review, recency, and public-trust statistics
Reviews influence whether a former customer remembers the company positively and whether a referred customer accepts the recommendation. BrightLocal's 2026 U.S. survey also shows that review operations are continuous: count, rating, recency, platform coverage, and owner response all matter.
| # | Review benchmark | Value | Source | Retention relevance |
|---|---|---|---|---|
| 48 | Consumers who read reviews for local businesses | 97% | BrightLocal, 2026 | Public feedback is mainstream |
| 49 | Consumers who always read reviews while browsing | 41% | BrightLocal, 2026 | Frequent research behavior |
| 50 | Average number of review sites consumers use | 6 sites | BrightLocal, 2026 | Trust spans platforms |
| 51 | Consumers using Google for local reviews and recommendations | 71% | BrightLocal, 2026 | Google remains central |
| 52 | Consumers who will not use a business with fewer than 20 reviews | 47% | BrightLocal, 2026 | Count creates a threshold |
| 53 | Consumers who care about star ratings | 92% | BrightLocal, 2026 | Rating shapes recall and choice |
| 54 | Consumers focused on reviews from the last three months | 74% | BrightLocal, 2026 | Recent service stays visible |
| 55 | Consumers calling an owner response important | 37% | BrightLocal, 2026 | Responses show public ownership |
Invite honest feedback from every eligible completed customer and route problems to a real owner. Use our guide to building a plumber review system for request timing, responses, and policy-safe execution.
8. Convenience, response, and repeat-choice statistics
A customer can like the technician and still choose another provider if the old company is hard to reach. Booking and response data explain why retention workflows must be visible, mobile-friendly, and owned by staff.
| # | Convenience benchmark | Value | Source | Retention use |
|---|---|---|---|---|
| 56 | Consumers reported as expecting online booking | 70% | ServiceTitan, 2024 | Provide a low-friction return path |
| 57 | New-contractor shoppers more likely to choose a provider offering online booking | 94% | ServiceTitan, 2024 | Competitors can win on convenience |
| 58 | Home-service customers expecting a same-day response | Over 70% | Jobber, 2026 | Same-day ownership matters |
| 59 | Home-service customers expecting a response within an hour | More than half | Jobber, 2026 | Fast acknowledgment is expected |
| 60 | Customers rating an immediate response important or very important | 90% | HubSpot | Cross-industry expectation |
| 61 | Customers defining immediate response as ten minutes or less | 60% | HubSpot | Cross-industry definition |
| 62 | Homeowners appreciating a technician name and photo before arrival | Nearly 60% | Housecall Pro | Pre-arrival trust cue |
| 63 | Homeowners comfortable with AI handling initial inquiries | 53% | Housecall Pro | Automation needs human escalation |
Owner takeaway: retention is not an annual campaign. It is the ability to recognize a returning customer, retrieve service history, offer a clear next step, and honor the handoff. Automation can acknowledge; a person still needs ownership.
9. Booking-funnel statistics that shape the retained-customer denominator
A retention report built on incomplete contact or booking data is misleading. ServiceTitan and Invoca provide context for the front of the funnel. They do not provide a retention rate, but they show how many opportunities can disappear before they ever become customers eligible to return.
| # | Funnel benchmark | Value | Source | Scope |
|---|---|---|---|---|
| 64 | Typical call-booking rate in trade-business analysis | 42% | ServiceTitan, 2022 | Multiple trades |
| 65 | Trade businesses in that booking analysis | 3,000+ | ServiceTitan, 2022 | Platform sample |
| 66 | Illustrative annual revenue associated with a five-point booking improvement for 5–14-tech shops | About $100K | ServiceTitan, 2022 | Estimate, not guarantee |
| 67 | Home-services phone leads converting during the call | 46% | Invoca via Supply House Times, 2025 | Multiple home-service trades |
| 68 | Callers who spoke with a person | 61% | Invoca, 2025 | Cross-industry dataset |
| 69 | Calls from digital marketing classified as qualified leads | 35% | Invoca, 2025 | Cross-industry dataset |
Use the plumber marketing ROI guide to carry source and cost through booked and completed revenue. Retention reporting should use the same customer and revenue definitions.
10. Mobile and email context for customer retention
Most plumbing retention workflows land on a phone. Pew shows the reach of mobile access; GetResponse offers broad email context. Email opens and clicks are not retention outcomes, but delivery and engagement can diagnose why reminders fail before booking.
| # | Channel benchmark | Value | Source | Retention interpretation |
|---|---|---|---|---|
| 70 | U.S. adults owning any cellphone | 98% | Pew Research Center, 2025 | Mobile contact is nearly universal |
| 71 | U.S. adults owning a smartphone | 91% | Pew Research Center, 2025 | Booking paths must work on mobile |
| 72 | U.S. adults relying on a smartphone without home broadband | 16% | Pew Research Center, 2025 | Some households are smartphone-only |
| 73 | Average email open rate | 39.64% | GetResponse | Global email context, not plumbing |
| 74 | Average email click-through rate | 3.25% | GetResponse | Global email context |
| 75 | Average email unsubscribe rate | 0.15% | GetResponse | Global email context |
Owner takeaway: measure delivery, reply, booking, completed job, and gross profit by workflow. Treat email opens as directional because privacy features can create activity without proving that a person read the message.
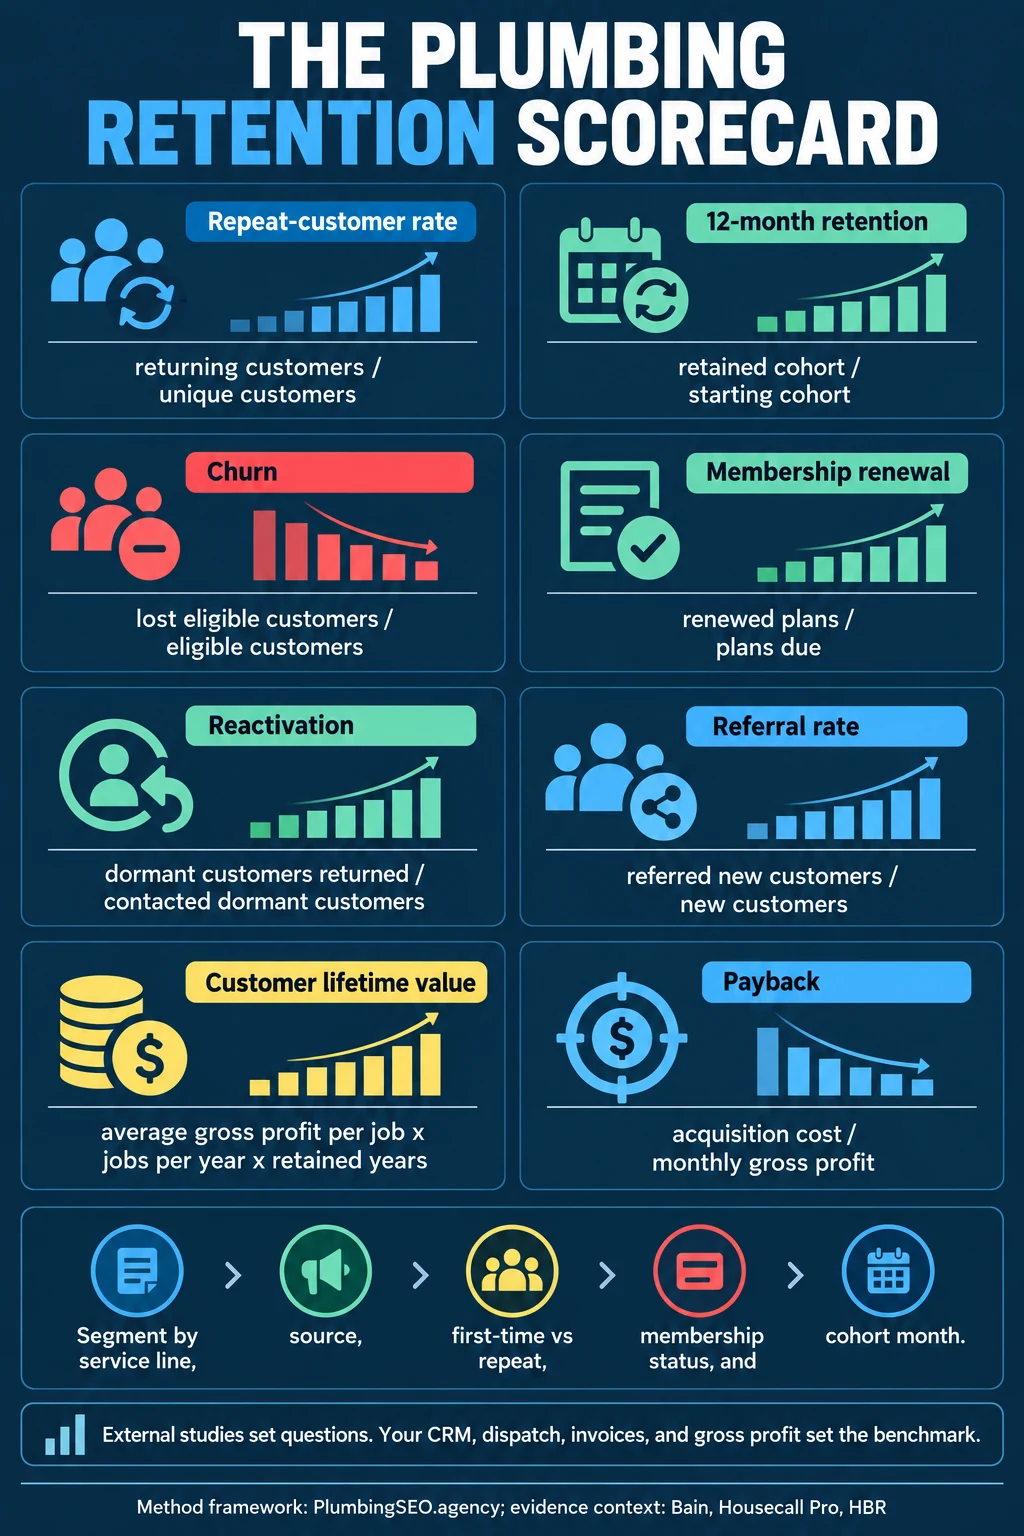
Build a plumbing customer-retention scorecard
External benchmarks help you ask questions. Your customer, dispatch, invoice, membership, and gross-profit records provide the answer. Start with one cohort and one eligibility rule, then keep the definitions fixed long enough to see a trend.
1Repeat-customer rate
Returning unique households ÷ all unique households servedState the period and whether the return must be a second paid completed job.
2Cohort retention
Starting cohort with qualifying return ÷ eligible starting cohortCompare customers acquired in the same month or quarter after equal observation windows.
3Membership renewal
Plans renewed ÷ plans due and eligibleSeparate payment failures, moves, cancellations, and company-initiated closures.
4Reactivation
Dormant customers with completed return job ÷ eligible dormant customers contactedDefine dormant, contact permission, campaign, and completion window.
5Referral rate
New customers from tracked referrals ÷ all new customersAlso measure referred lead-to-booking and referred-customer gross profit.
6Historical LTV
Collected gross profit from cohort ÷ unique cohort customersUse gross profit, not revenue, when comparing acquisition and retention investments.
A monthly retention review
- Deduplicate households and fix merged, split, or missing customer records.
- Separate first jobs, paid repeat jobs, warranty callbacks, membership visits, and no-charge recovery work.
- Compare cohorts by acquisition source, service line, ZIP code, membership status, and first-job outcome.
- Read cancellation reasons, complaint tags, dormant-customer replies, and recent review themes.
- Choose one leak—missed reminders, unfulfilled benefits, payment failure, no callback, poor closeout, or weak data—and assign an owner.
- Report whether the fix changed renewal, completed repeat work, referral volume, or gross profit.
Plumbing customer retention statistics: owner summary table
This compact table collects the most decision-useful figures from the 75-stat report. Follow the source link and scope before using any figure in a forecast or presentation.
| Area | Benchmark | Value | Source |
|---|---|---|---|
| Repeat hire | Homeowners saying they would hire the same company again | 68% | Housecall Pro |
| Referral | Homeowners willing to refer after an excellent experience | 73% | Housecall Pro |
| Retention economics | Profit range associated with a 5% retention increase | 25%–95% | Bain |
| Acquisition | Frequently cited acquisition cost relative to retention | 5×–25× | HBR |
| Referred LTV | Higher lifetime value in an observed bank program | 16% | HBR |
| Referral trust | Trust recommendations from people they know | 88% | Nielsen |
| Churn risk | Would leave a loved brand after one bad experience | 32% | PwC |
| Repeated friction | Would leave after several bad experiences | 59% | PwC |
| Repurchase | Good service makes another purchase more likely | 94% | Salesforce |
| Booking | Factor online booking into home-service provider choice | 80% | Housecall Pro |
| Reminders | Trade-service planning checkpoints | 90/60/30/7–14 days | Simpro |
| Text recovery | Reply rate in a home-service missed-call study | 32.7% | 99 Calls |
| Reviews | Consumers focused on reviews from the last three months | 74% | BrightLocal |
| Response | Home-service customers expecting same-day response | Over 70% | Jobber |
| Mobile | U.S. adults owning a smartphone | 91% | Pew Research Center |
Methodology and source notes
This article was published October 21, 2026. It contains 75 numbered entries from 17 source families. We prioritized original research, first-party platform analyses, home-service surveys, established consumer studies, and sources that expose sample or scope. The data spans different years because a source's publication date is not interchangeable with the year this guide was compiled.
What we excluded: unattributed claims about universal plumbing retention rates, unsupported membership conversion or renewal benchmarks, synthetic customer-lifetime-value multipliers, and vendor claims without a visible metric definition. We did not calculate a blended plumbing average from unrelated surveys.
- Housecall Pro Home Service Customer Service Report (2025) — online survey of 1,040 U.S. homeowner decision-makers.
- Bain & Company retention research — classic cross-industry retention and profit framing.
- Harvard Business Review: The Value of Keeping the Right Customers — acquisition-versus-retention cost context.
- Harvard Business Review / Journal of Marketing referral research — observed value and churn among bank customers acquired by referral.
- Adobe Digital Index — online retail visitor and revenue concentration; not home-service behavior.
- McKinsey paid loyalty research — consumer loyalty-program behavior, not plumbing membership performance.
- Simpro service reminder guidance — trade-service reminder planning checkpoints.
- 99 Calls Missed-Call Text-Back Study (2026) — 14,354 messages across 192 home-service businesses.
- PwC Future of Customer Experience — cross-industry experience, convenience, and customer-loss research.
- Salesforce State of the Connected Customer — cross-industry service and experience expectations.
- Nielsen Trust in Advertising (2021) — recommendation trust across global consumers.
- BrightLocal Local Consumer Review Survey (2026) — U.S. local review behavior.
- ServiceTitan online booking research (2024) and call-booking analysis (2022) — contractor convenience and booking context.
- Jobber Home Service Trends Report (2026) — home-service response expectations.
- HubSpot customer-service statistics — cross-industry response expectations.
- Invoca call benchmarks via Supply House Times (2025) — large call-performance dataset with home-service segment.
- Pew Research Center Mobile Fact Sheet (2025) and GetResponse email benchmarks — channel-access and broad engagement context.
Frequently asked questions about plumbing customer retention
There is no credible universal rate. Emergency repairs, planned replacements, rental portfolios, memberships, customer mobility, and the observation window all change the result. Define a qualifying return, compare equal cohorts, and use your own history as the baseline.
Divide returning unique households by all unique households served during a stated period. Define whether a return must be a second paid completed job, and exclude warranty callbacks, duplicate records, and no-charge recovery visits unless the dashboard labels them separately.
Public plumbing-specific evidence is too thin for one universal target. Calculate plans renewed divided by plans due and eligible, then segment by cohort, plan design, price, payment status, promised visits fulfilled, service area, and cancellation reason.
Make the next interaction easy: keep clean customer and equipment history, confirm the repair, document work, communicate delays, explain pricing, fulfill plan benefits, send relevant permissioned reminders, recover complaints, and give every reply a named owner.
For historical LTV, divide collected gross profit from a defined customer cohort by unique customers in that cohort. For planning, multiply average gross profit per job by jobs per year and retained years, then test low, base, and high assumptions.
Reviews are not a retention rate, but they preserve public memory of the service experience, influence referrals, and reveal recurring issues. Track review themes alongside complaints, repeat jobs, renewals, and customer-loss reasons.
Can past customers find and choose your plumbing company again?
We can review the local visibility, service pages, tracking, and conversion paths that turn first-time searches into measurable, profitable customer relationships.
Run My Free SEO Leak Check