
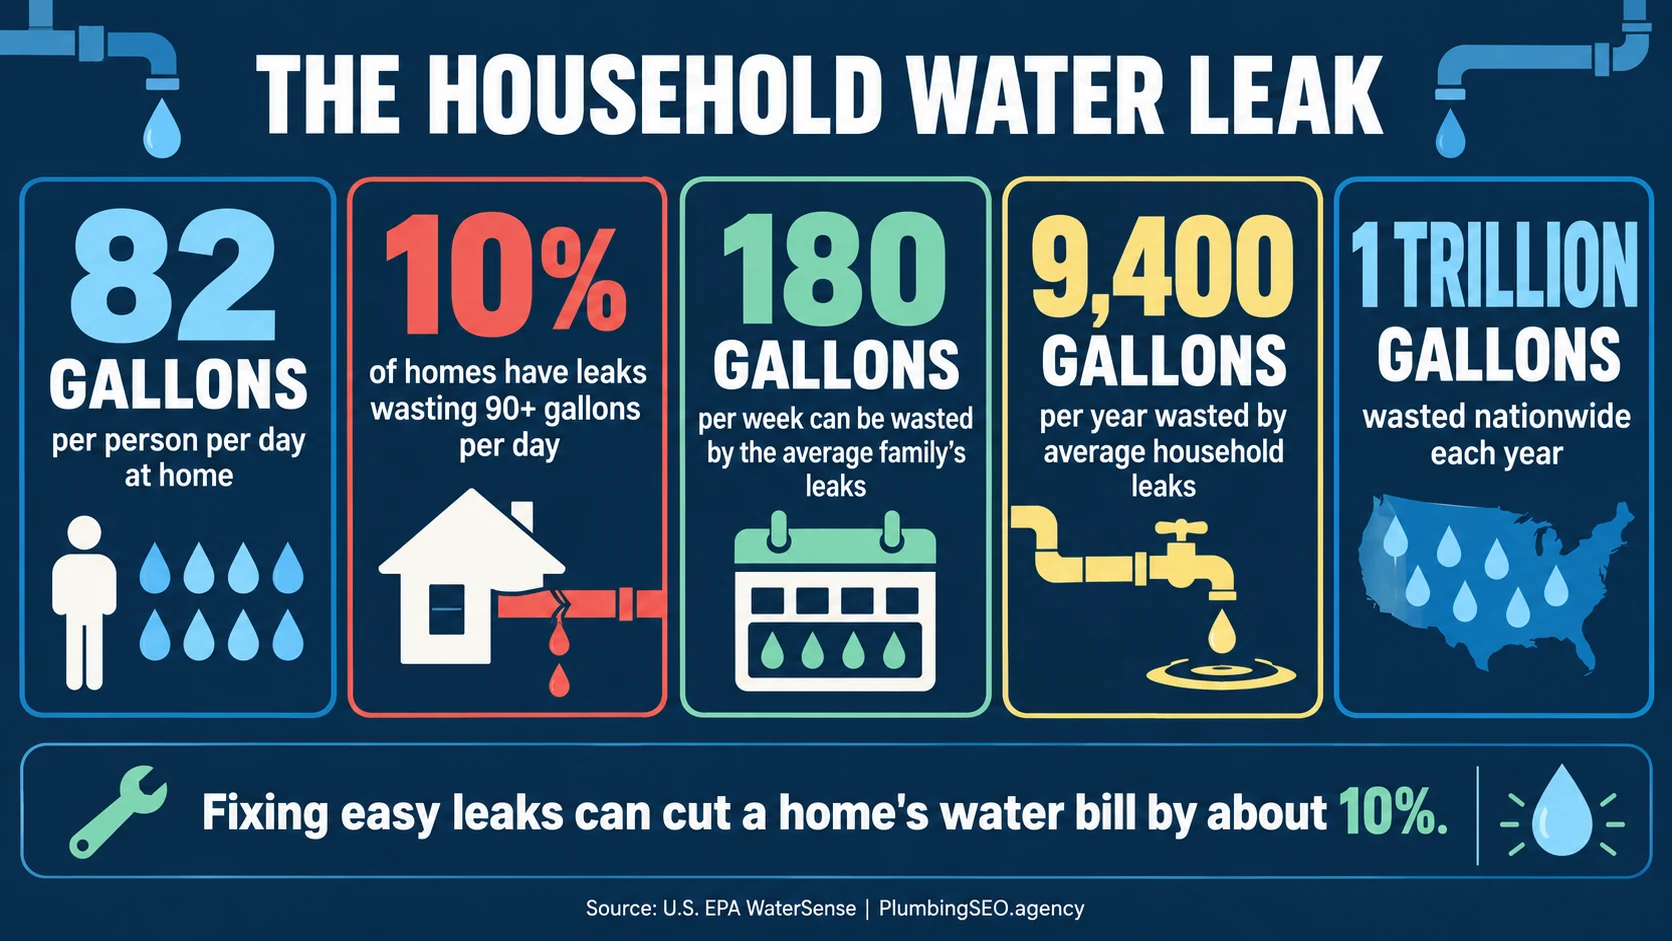
- Leaks are measurable demand: household leaks waste close to a trillion gallons nationally in a year, and simple repairs can trim a household water bill by about 10%.
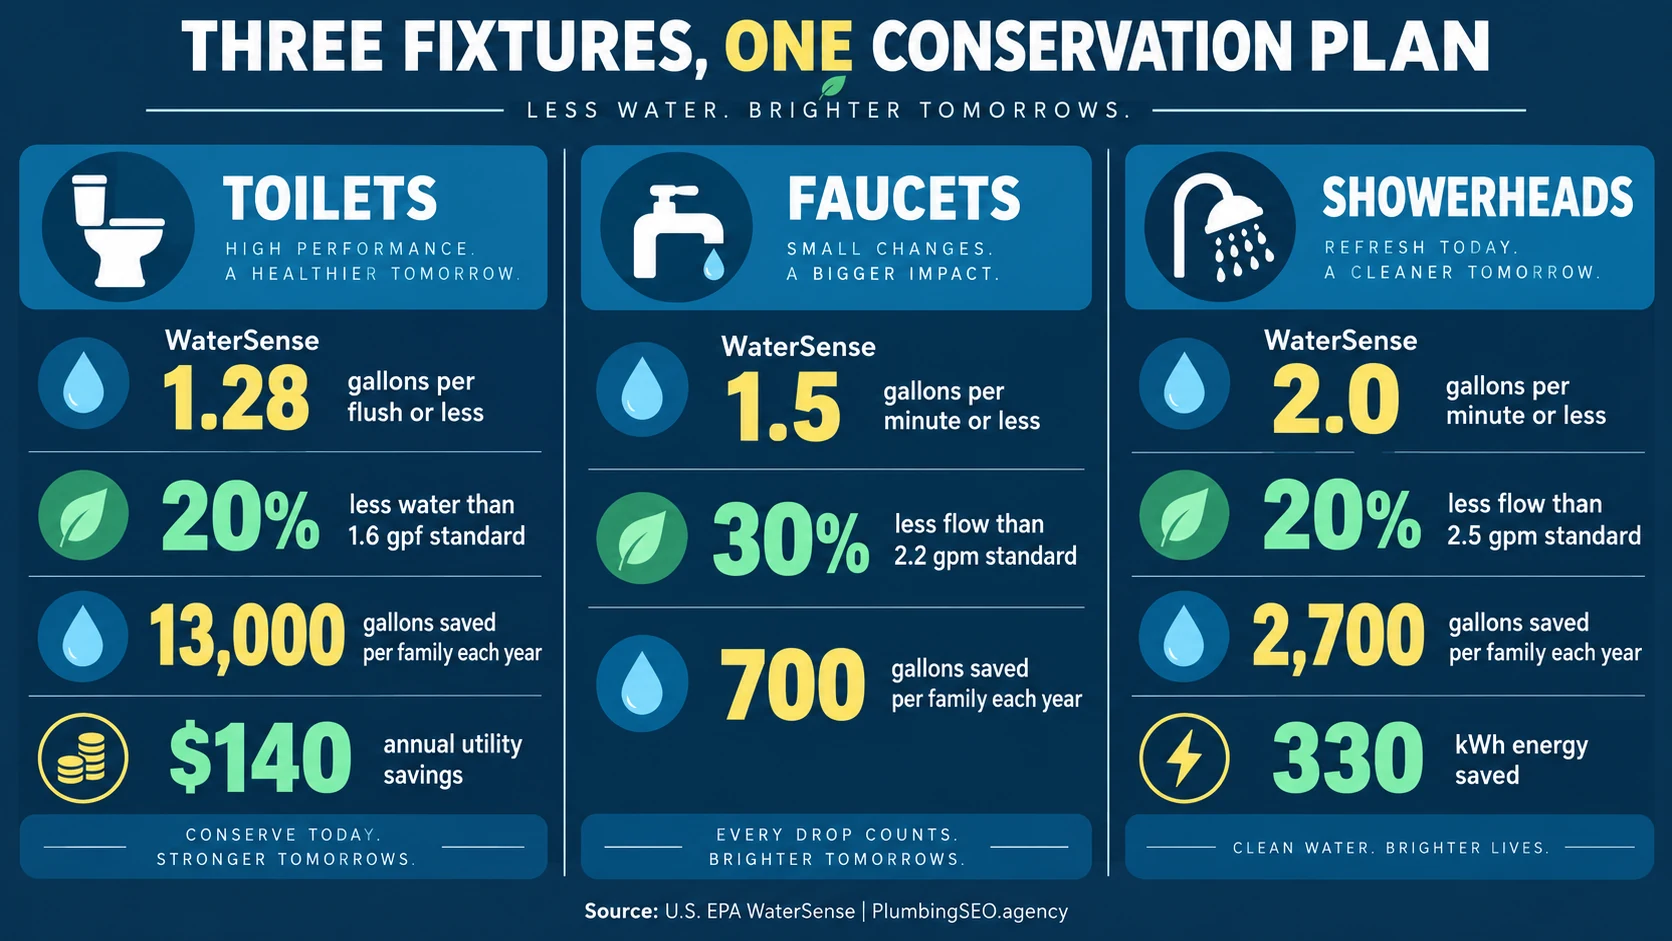
- Fixtures create clear retrofit math: WaterSense toilets, faucets and showerheads use at least 20% less water than standard federal baselines while meeting performance criteria.
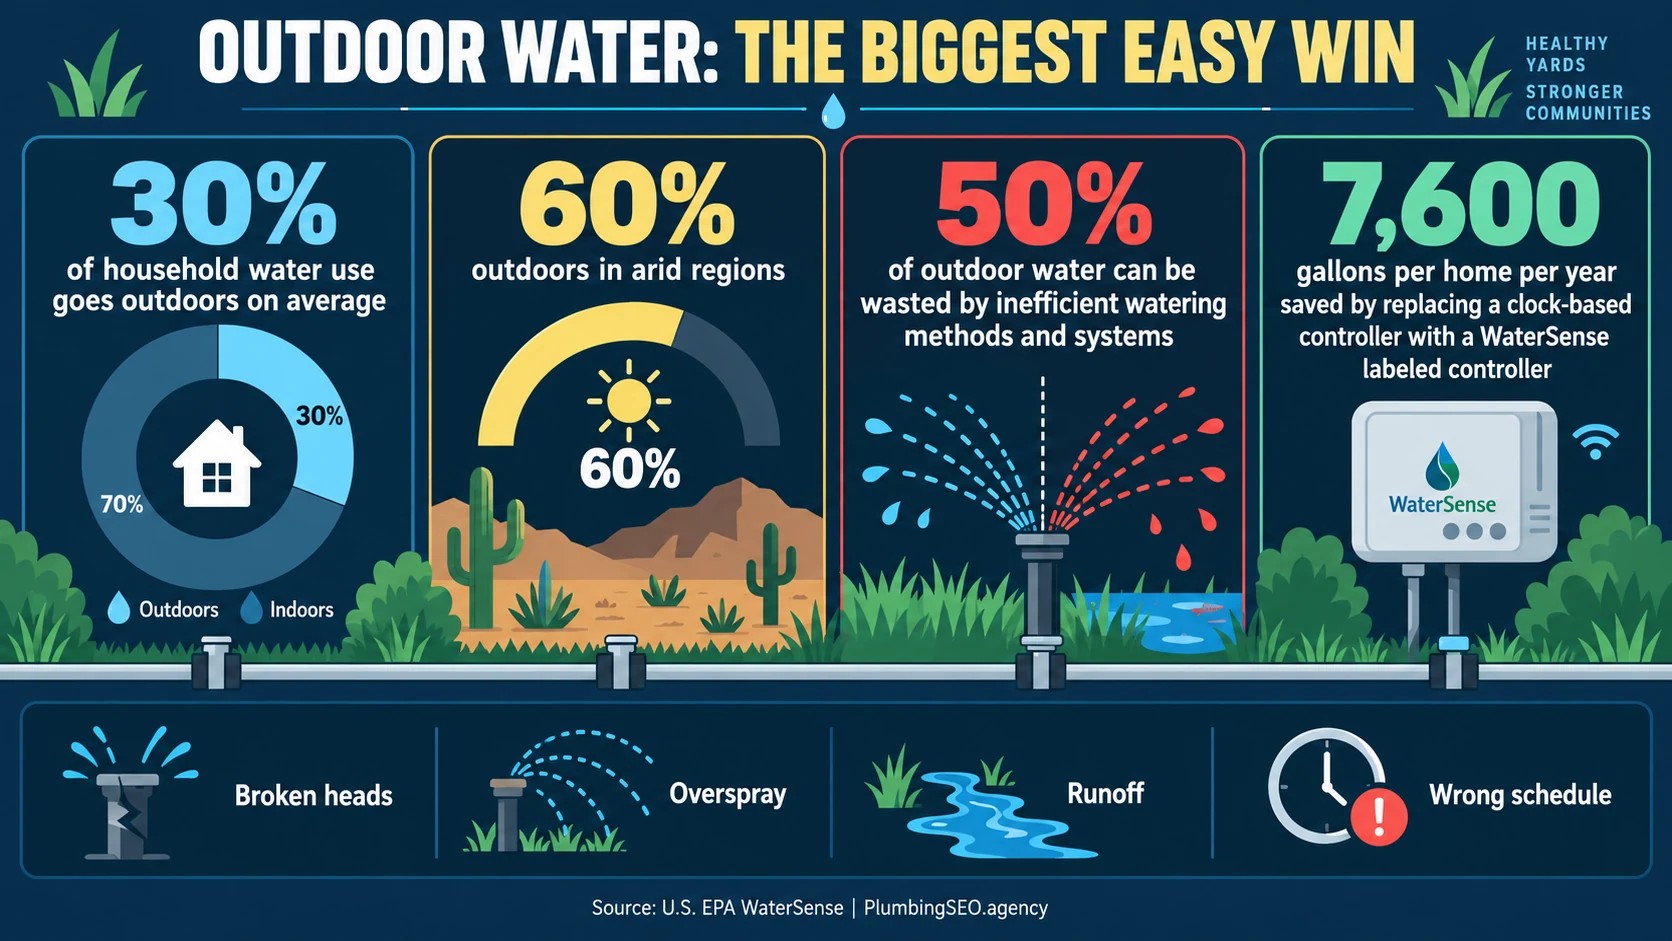
- Outdoor systems deserve a service line: roughly 30% of household water goes outdoors on average, and inefficient irrigation can waste about half of that water.
- Context beats hype: the newest comprehensive USGS national withdrawal dataset is from 2015, while fixture standards and savings pages are updated separately. Each row below keeps its source year and scope.
A slow toilet leak does not look dramatic. Neither does a spray head watering the sidewalk. Put those small losses across millions of homes, and the numbers get big fast. Water conservation is not one product or one lecture. It is a chain of practical jobs: find the leak, measure the flow, choose the right fixture, set the controller correctly, and verify that the repair worked.
This guide gathers 101 numbered U.S. water conservation benchmarks from federal agencies, research foundations, efficiency programs and Census data. It is written for homeowners, plumbing companies, utility communicators and anyone who needs source-linked numbers without mixing a national withdrawal estimate with a household bill claim.
- EPA uses 82 gallons per person per day as a current household benchmark (EPA WaterSense).
- The Water Research Foundation study measured 58.6 gallons per person per day of indoor use in its study homes (WRF, 2016).
- Toilets represented 24% of indoor use in that study, the largest named indoor category.
- A WaterSense toilet uses 1.28 gallons per flush or less, compared with the federal 1.6-gallon standard.
- A WaterSense bathroom faucet flows at 1.5 gallons per minute or less.
- A WaterSense showerhead flows at 2.0 gallons per minute or less.
- A family can save roughly 13,000 gallons a year by replacing old, inefficient toilets.
- A WaterSense showerhead can save an average family about 2,700 gallons a year.
- Outdoor use accounts for about 30% of household water use nationally and can reach 60% in arid regions.
- EPA says as much as 50% of outdoor water is lost to inefficient methods and systems.
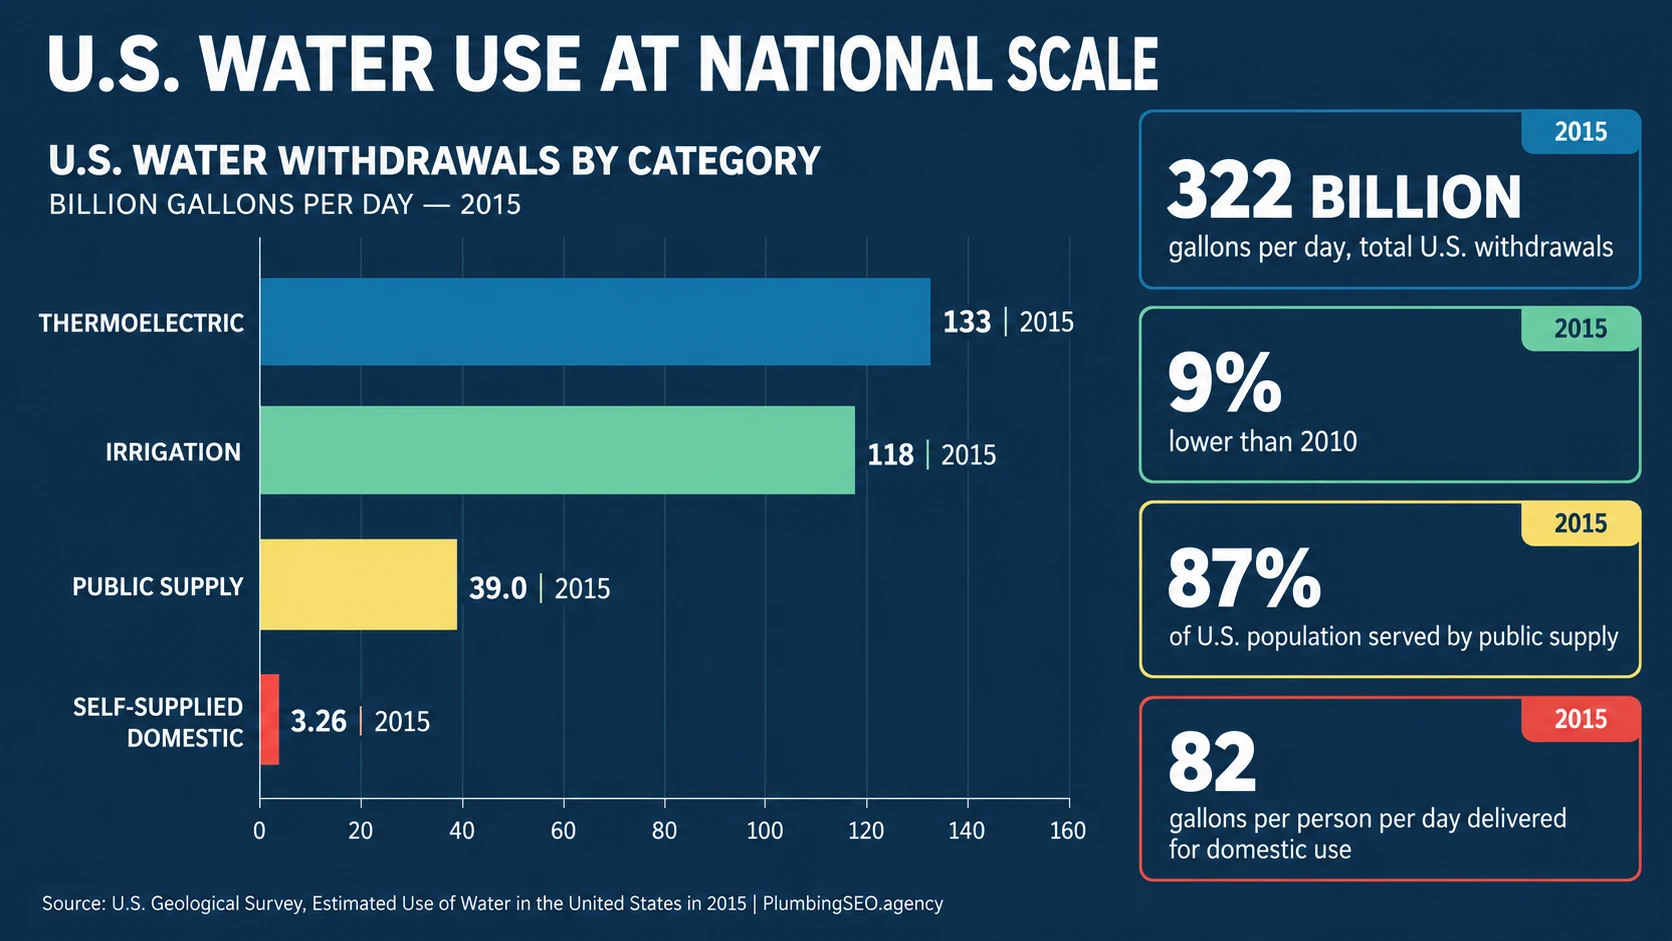
- USGS estimated total U.S. withdrawals at 322 billion gallons per day in 2015, down 9% from 2010.
- EPA's 2021 assessment identified $625 billion in drinking-water infrastructure needs over 20 years.
1. Household leak statistics
Leak conservation is where plumbing skill and homeowner savings meet. The first job is not to sell a replacement. It is to identify the loss, confirm the source, explain the repair and prove the meter stopped moving.
| # | Leak benchmark | Value | Source | Year or scope |
|---|---|---|---|---|
| 1 | Household leak waste nationwide | Nearly 1 trillion gal/year | EPA Fix a Leak Week | Current guidance, source accessed 2026 |
| 2 | Homes in EPA's widely cited high-leak benchmark | About 10% | EPA statistics and facts | Published WaterSense benchmark, source accessed 2026 |
| 3 | Waste threshold in that high-leak benchmark | 90+ gal/day | EPA WaterSense | Household threshold, source accessed 2026 |
| 4 | Water an average family's leaks can waste each week | 180 gal/week | EPA WaterSense | Published household benchmark, source accessed 2026 |
| 5 | Annual water wasted by average household leaks | About 9,400 gal/year | EPA WaterSense | Rounded annual estimate, source accessed 2026 |
| 6 | Potential water-bill reduction after fixing easy leaks | About 10% | EPA Fix a Leak Week | Current guidance, source accessed 2026 |
| 7 | Faucet drip rate used in EPA example | 1 drip/second | EPA Fix a Leak Week | Example rate, source accessed 2026 |
| 8 | Annual waste from that dripping faucet | 3,000+ gal/year | EPA Fix a Leak Week | EPA example, source accessed 2026 |
| 9 | Annual waste from a showerhead leaking 10 drips per minute | 500+ gal/year | EPA Fix a Leak Week | EPA example, source accessed 2026 |
| 10 | Monthly waste from a 1/32-inch irrigation leak | About 6,300 gal/month | EPA Fix a Leak Week | Outdoor example, source accessed 2026 |
| 11 | No-use meter-check window | 2 hours | EPA Fix a Leak Week | Household test, source accessed 2026 |
| 12 | Food-coloring toilet leak test | 10 minutes | EPA Fix a Leak Week | Tank test window, source accessed 2026 |
For a plumbing company, these numbers support a clean diagnostic offer: meter check, fixture inspection, toilet dye test, pressure review and repair options. A strong leak detection service guide should help the customer recognize symptoms without turning every drip into a scare story.
2. Indoor residential water-use statistics
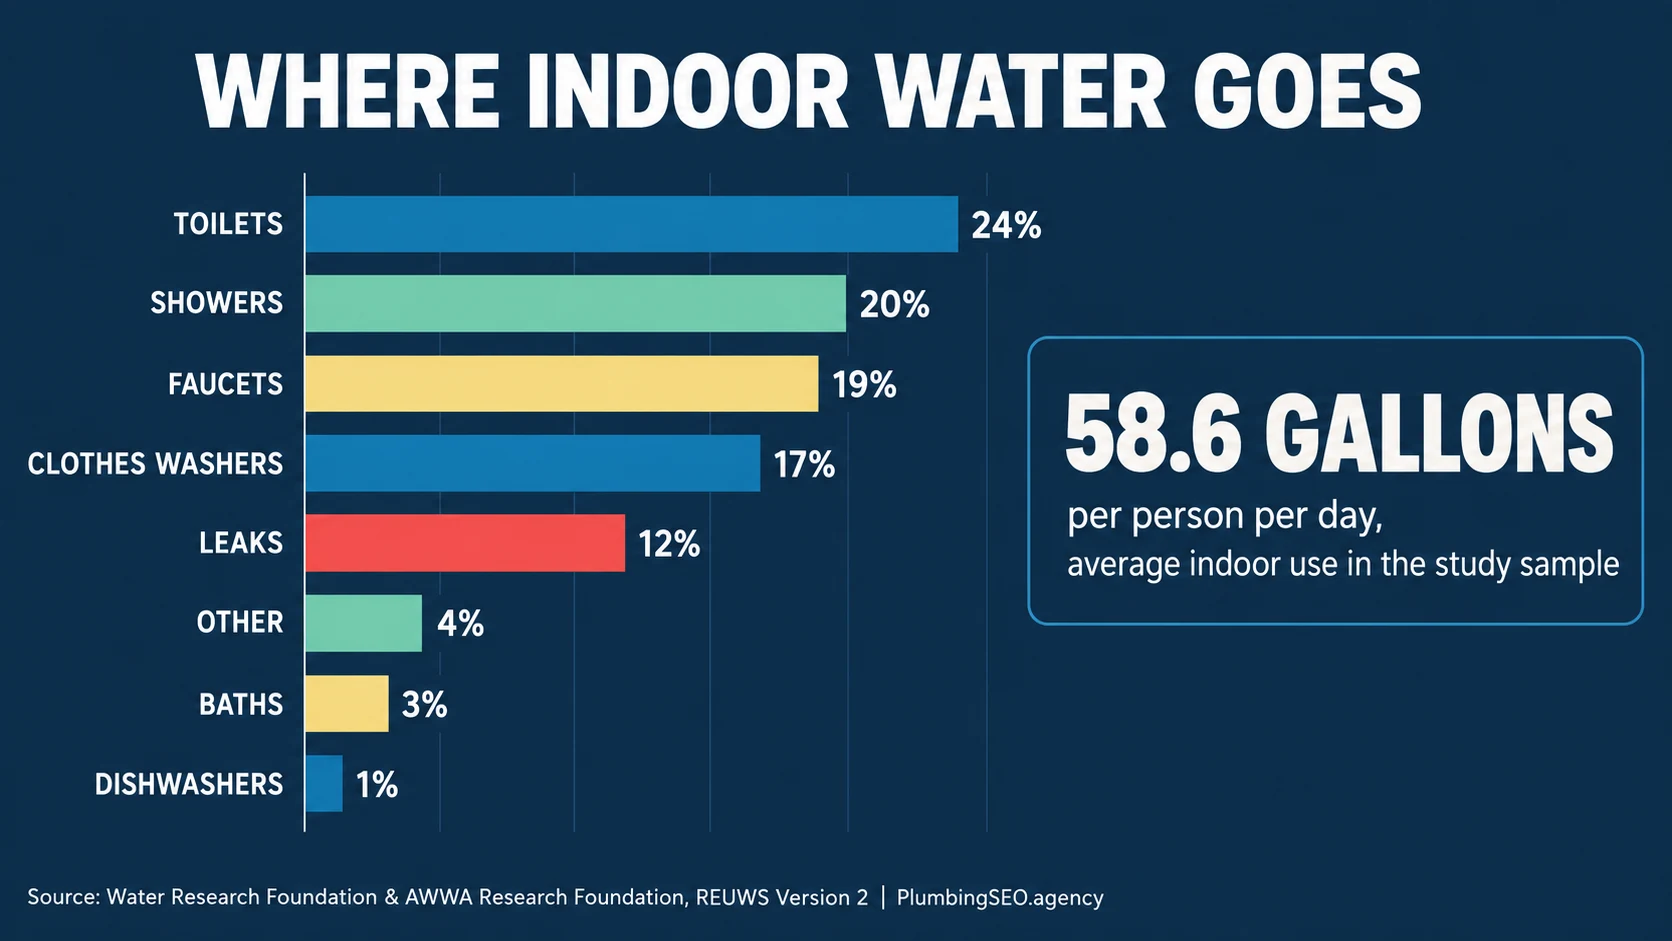
Two valid per-person figures appear below because they measure different things. EPA's 82-gallon figure is a broad current household benchmark. The Water Research Foundation's 58.6-gallon figure is measured indoor use across its study sample. Keep that scope attached.
| # | Indoor-use benchmark | Value | Source | Year or scope |
|---|---|---|---|---|
| 13 | Household water use per person | 82 gal/day | EPA WaterSense | Current broad benchmark, source accessed 2026 |
| 14 | Average family household use | 300+ gal/day | EPA How We Use Water | Current broad benchmark, source accessed 2026 |
| 15 | Indoor water used in bathrooms | More than 50% | EPA WaterSense | Household indoor use, source accessed 2026 |
| 16 | Measured indoor use per person in REUWS Version 2 | 58.6 gal/day | Water Research Foundation | 2016 study sample, source accessed 2026 |
| 17 | Measured indoor use per household | 138 gal/day | Water Research Foundation | 2016 study sample, source accessed 2026 |
| 18 | Toilet share of indoor use | 24% | WRF REUWS Version 2 | 2016 study, source accessed 2026 |
| 19 | Shower share of indoor use | 20% | WRF REUWS Version 2 | 2016 study, source accessed 2026 |
| 20 | Faucet share of indoor use | 19% | WRF REUWS Version 2 | 2016 study, source accessed 2026 |
| 21 | Clothes-washer share of indoor use | 17% | WRF REUWS Version 2 | 2016 study, source accessed 2026 |
| 22 | Leak share of indoor use | 12% | WRF REUWS Version 2 | 2016 study, source accessed 2026 |
| 23 | Bath share of indoor use | 3% | WRF REUWS Version 2 | 2016 study, source accessed 2026 |
| 24 | Dishwasher share of indoor use | 1% | WRF REUWS Version 2 | 2016 study, source accessed 2026 |
3. Toilet efficiency and replacement statistics
Toilets offer some of the clearest retrofit math in the house. The gallon-per-flush label gives the plumber and homeowner a common starting point. The field check still matters because a low-flow label does not fix a worn flapper, a bad fill valve or a poor installation.
| # | Toilet benchmark | Value | Source | Year or scope |
|---|---|---|---|---|
| 25 | Toilet share of an average home's indoor water use | Nearly 30% | EPA residential toilets | Current EPA category page, source accessed 2026 |
| 26 | Flush volume of many older toilets | Up to 6 gal/flush | EPA WaterSense | Pre-standard fixtures, source accessed 2026 |
| 27 | Federal maximum for new residential toilets | 1.6 gal/flush | U.S. Department of Energy | Federal standard since 1994, source accessed 2026 |
| 28 | WaterSense maximum flush volume | 1.28 gal/flush | EPA residential toilets | Current specification, source accessed 2026 |
| 29 | Water reduction versus the 1.6-gallon standard | 20% | EPA WaterSense | Labeled toilets, source accessed 2026 |
| 30 | Potential family water savings from replacing old toilets | 13,000 gal/year | EPA WaterSense | Average family estimate, source accessed 2026 |
| 31 | Potential annual water-cost savings | $140/year | EPA WaterSense | Average family estimate, source accessed 2026 |
| 32 | Potential lifetime savings | $2,900 | EPA WaterSense | Toilet lifetime estimate, source accessed 2026 |
| 33 | Potential national savings if old inefficient toilets were replaced | 520 billion gal/year | EPA WaterSense | National scenario, source accessed 2026 |
| 34 | Potential national consumer savings in that scenario | $5.3 billion/year | EPA WaterSense | Water-bill scenario, source accessed 2026 |
4. Faucet and showerhead conservation statistics
Flow-rate upgrades can cut both water and water-heating demand. That double benefit is why a showerhead or aerator change can produce savings beyond the utility's water line item.
| # | Faucet or shower benchmark | Value | Source | Year or scope |
|---|---|---|---|---|
| 35 | Standard bathroom faucet flow baseline | 2.2 gal/min | EPA bathroom faucets | Federal standard, source accessed 2026 |
| 36 | WaterSense bathroom faucet flow | 1.5 gal/min or less | EPA WaterSense | Current specification, source accessed 2026 |
| 37 | Faucet flow reduction | 30%+ | EPA WaterSense | Versus standard flow, source accessed 2026 |
| 38 | Potential family faucet savings | 700 gal/year | EPA WaterSense | Average family estimate, source accessed 2026 |
| 39 | Shower equivalent of that faucet savings | 45 showers | EPA WaterSense | EPA comparison, source accessed 2026 |
| 40 | Potential national faucet water savings | 69 billion gal/year | EPA WaterSense | All-household scenario, source accessed 2026 |
| 41 | Potential national faucet water and energy savings | $1.3 billion/year | EPA WaterSense | All-household scenario, source accessed 2026 |
| 42 | Shower share of residential indoor water use | Nearly 17% | EPA showerheads | Current EPA page, source accessed 2026 |
| 43 | Average family shower use | Nearly 40 gal/day | EPA WaterSense | Household estimate, source accessed 2026 |
| 44 | U.S. shower water use | Nearly 1.2 trillion gal/year | EPA WaterSense | National estimate, source accessed 2026 |
| 45 | Standard showerhead flow baseline | 2.5 gal/min | EPA showerheads | Federal standard, source accessed 2026 |
| 46 | WaterSense showerhead flow | 2.0 gal/min or less | EPA WaterSense | Current specification, source accessed 2026 |
| 47 | Showerhead flow reduction | 20% | EPA WaterSense | Versus standard flow, source accessed 2026 |
| 48 | Potential family showerhead water savings | 2,700 gal/year | EPA WaterSense | Average family estimate, source accessed 2026 |
| 49 | Potential annual electricity savings | 330 kWh/year | EPA WaterSense | Reduced water heating, source accessed 2026 |
| 50 | Potential family utility savings | $70/year | EPA WaterSense | Water and energy estimate, source accessed 2026 |
The gallon-per-minute number is not the whole job. Pressure, hot-water delivery, pipe condition and customer preference all affect whether an upgrade feels like an improvement. A callback wipes out the goodwill from a small efficiency win, so verify the spray pattern and temperature before packing the tools.
5. Appliance and hot-water efficiency statistics
Water and energy overlap whenever water is heated or pumped. That makes laundry, dishwashing and hot-water equipment part of the same conservation conversation, even when the savings appear on two separate bills.
| # | Appliance or hot-water benchmark | Value | Source | Year or scope |
|---|---|---|---|---|
| 51 | Water used by an ENERGY STAR full-size clothes washer | About 14 gal/load | ENERGY STAR clothes washers | Current product guidance, source accessed 2026 |
| 52 | Water used by a standard full-size washer | About 20 gal/load | ENERGY STAR | Current comparison, source accessed 2026 |
| 53 | Certified clothes-washer water reduction | About 30% | ENERGY STAR | Versus standard models, source accessed 2026 |
| 54 | Certified clothes-washer energy reduction | About 20% | ENERGY STAR | Versus standard models, source accessed 2026 |
| 55 | ENERGY STAR standard-size dishwasher water limit | 3.2 gal/cycle | ENERGY STAR dishwashers | Current specification context, source accessed 2026 |
| 56 | Certified dishwasher water efficiency improvement | About 30% | ENERGY STAR | Versus standard models, source accessed 2026 |
| 57 | Water heating share of household energy use | About 18% | DOE Energy Saver | Current consumer guidance, source accessed 2026 |
| 58 | Typical annual household water-heating cost | $400–$600 | DOE Energy Saver | Household range, source accessed 2026 |
| 59 | Tankless efficiency advantage at 41 gallons or less hot-water use daily | 24%–34% | DOE tankless water heaters | Low-use homes, source accessed 2026 |
| 60 | Tankless efficiency advantage at about 86 gallons of hot-water use daily | 8%–14% | DOE tankless water heaters | High-use homes, source accessed 2026 |
Equipment selection still needs a load calculation and a real conversation about use. Our tankless water heater guide for plumbing companies explains how to educate customers without presenting one technology as the answer for every house.
6. Outdoor water and irrigation statistics
Outdoor conservation is usually a scheduling and distribution problem before it is a landscaping problem. Broken heads, overspray, runoff and controllers set for the wrong season are all visible, fixable losses.
| # | Outdoor benchmark | Value | Source | Year or scope |
|---|---|---|---|---|
| 61 | Average household water used outdoors | About 30% | EPA WaterSense outdoors | National average, source accessed 2026 |
| 62 | Household use that can go outdoors in arid regions | Up to 60% | EPA WaterSense | Arid-region context, source accessed 2026 |
| 63 | Residential outdoor water use | Nearly 9 billion gal/day | EPA WaterSense | National estimate, source accessed 2026 |
| 64 | Outdoor water potentially wasted by inefficient methods and systems | As much as 50% | EPA WaterSense | Outdoor-use estimate, source accessed 2026 |
| 65 | Potential household savings from a WaterSense weather-based controller | 7,600 gal/year | EPA labeled controllers | Average home scenario, source accessed 2026 |
| 66 | Water reduction from replacing clock-based controllers | Up to 20% | EPA WaterSense | Landscape irrigation, source accessed 2026 |
| 67 | Potential national controller water savings | 220 billion gal/year | EPA WaterSense | Replacement scenario, source accessed 2026 |
| 68 | Potential national controller cost savings | $2.5 billion/year | EPA WaterSense | Replacement scenario, source accessed 2026 |
| 69 | Potential household savings from pressure-regulating spray sprinkler bodies | 5,600 gal/year | EPA spray sprinkler bodies | Average home scenario, source accessed 2026 |
| 70 | Potential national sprinkler-body water savings | 31 billion gal/year | EPA WaterSense | Replacement scenario, source accessed 2026 |
| 71 | Potential national sprinkler-body cost savings | $1 billion/year | EPA WaterSense | Replacement scenario, source accessed 2026 |
7. U.S. water withdrawal and public-supply statistics
USGS publishes the country's most comprehensive water-use estimates on a five-year dataset cycle, but the 2015 report remains the latest full national compilation currently available. These are withdrawals from sources, not a household conservation scorecard.
| # | National water-use benchmark | Value | Source | Year or scope |
|---|---|---|---|---|
| 72 | Total U.S. water withdrawals | 322 billion gal/day | USGS total water use | 2015, source accessed 2026 |
| 73 | Change in total withdrawals from 2010 | 9% decrease | USGS | 2010 to 2015, source accessed 2026 |
| 74 | Historical position of 2015 withdrawals | Lowest since before 1970 | USGS | National series, source accessed 2026 |
| 75 | Thermoelectric power withdrawals | 133 billion gal/day | USGS Circular 1441 | 2015, source accessed 2026 |
| 76 | Thermoelectric share of total withdrawals | 41% | USGS Circular 1441 | 2015, source accessed 2026 |
| 77 | Irrigation withdrawals | 118 billion gal/day | USGS Circular 1441 | 2015, source accessed 2026 |
| 78 | Public-supply withdrawals | 39.0 billion gal/day | USGS Circular 1441 | 2015, source accessed 2026 |
| 79 | Self-supplied domestic withdrawals | 3.26 billion gal/day | USGS Circular 1441 | 2015, source accessed 2026 |
| 80 | Groundwater withdrawals | 82.3 billion gal/day | USGS Circular 1441 | 2015, source accessed 2026 |
| 81 | Surface-water withdrawals | 237 billion gal/day | USGS Circular 1441 | 2015, source accessed 2026 |
| 82 | Saline-water withdrawals | 32.1 billion gal/day | USGS Circular 1441 | 2015, source accessed 2026 |
| 83 | Population served by public supply | 283 million | USGS Circular 1441 | 2015, source accessed 2026 |
| 84 | U.S. population share served by public supply | 87% | USGS Circular 1441 | 2015, source accessed 2026 |
| 85 | Public-supply domestic delivery rate | 82 gal/person/day | USGS Circular 1441 | 2015, source accessed 2026 |
8. Drinking-water infrastructure and loss statistics
Conservation does not stop at the meter. Utilities also lose treated water through aging mains and service lines. EPA's needs assessment describes the capital side, while ASCE's infrastructure report shows why replacement and leak management remain long-term work.
| # | Infrastructure benchmark | Value | Source | Year or scope |
|---|---|---|---|---|
| 86 | Documented drinking-water infrastructure need | $625 billion | EPA DWINSA | 2021 survey, 20-year need, source accessed 2026 |
| 87 | Assessment planning horizon | 20 years | EPA DWINSA | 2021 assessment, source accessed 2026 |
| 88 | Transmission and distribution share of need | About 67% | EPA DWINSA | 2021 assessment, source accessed 2026 |
| 89 | Treatment share of need | About 13% | EPA DWINSA | 2021 assessment, source accessed 2026 |
| 90 | Storage share of need | About 11% | EPA DWINSA | 2021 assessment, source accessed 2026 |
| 91 | Source share of need | About 8% | EPA DWINSA | 2021 assessment, source accessed 2026 |
| 92 | U.S. drinking-water pipe network | 2.2 million miles | ASCE drinking water | 2025 assessment, source accessed 2026 |
| 93 | Estimated treated water lost each day | 6 billion gal/day | ASCE 2025 | National estimate, source accessed 2026 |
| 94 | Estimated water-main break interval | Every 2 minutes | ASCE 2025 | National rate, source accessed 2026 |
| 95 | National drinking-water infrastructure grade | C- | ASCE 2025 | Infrastructure report card, source accessed 2026 |
9. U.S. housing and retrofit opportunity statistics
The number of homes sets the scale of the retrofit opportunity. Census occupancy counts are not proof that a fixture needs replacement. They show how many separate properties, owners and renters may face decisions about leaks, toilets, faucets, showerheads, water heaters and irrigation.
| # | Housing benchmark | Value | Source | Year or scope |
|---|---|---|---|---|
| 96 | Total U.S. housing units | 140,498,736 | U.S. Census Bureau | 2020 Census, source accessed 2026 |
| 97 | Occupied housing units | 126,817,580 | U.S. Census Bureau | 2020 Census, source accessed 2026 |
| 98 | Owner-occupied units | 80,035,754 | U.S. Census Bureau | 2020 Census, source accessed 2026 |
| 99 | Renter-occupied units | 46,781,826 | U.S. Census Bureau | 2020 Census, source accessed 2026 |
| 100 | Vacant housing units | 13,681,156 | U.S. Census Bureau | 2020 Census, source accessed 2026 |
| 101 | Occupied share of housing inventory | About 90.3% | U.S. Census Bureau | Calculated from 2020 counts, source accessed 2026 |
Ownership changes who approves the work, not whether the leak matters. Plumbers serving rental portfolios need clear inspection records, fixture model details and before-and-after readings so a property manager can approve the next unit without starting from scratch.
10. Drought and regional supply context
Drought is not one national condition. The U.S. Drought Monitor updates conditions weekly and uses categories from D0, abnormally dry, through D4, exceptional drought. That moving map is more useful than freezing one national percentage into a 2026 article.
Regional systems show why local context matters. The Bureau of Reclamation describes a Colorado River Basin spanning seven U.S. states and Mexico, supporting roughly 40 million people, 30 Tribal Nations and 5.5 million acres of agriculture. A conservation message in that basin carries different urgency than one in a water-rich market, but neither excuses a plumbing company from checking local codes, rebates and utility rules before recommending equipment.
11. What plumbing companies should do with the data
Do not turn 101 statistics into a sales script. Use them to tighten the service process and make recommendations easier to verify.
Start with the meter
Record a no-use meter reading, confirm whether the loss is continuous and separate fixture leaks from underground or irrigation losses.
Label the old fixture
Photograph the model and flow or flush marking. A real baseline makes the savings conversation honest.
Quote repair and replace
When both are reasonable, show both. A flapper may solve the leak today. An old six-gallon toilet may still justify a replacement option.
Check pressure and performance
Efficiency should not create a weak shower or a callback. Verify pressure, spray pattern, temperature and refill operation.
Match local programs
Keep utility rebate links, approved product lists and watering rules by service area. Date every handout because programs change.
Track the booked work
Separate leak detection, toilet repair, fixture retrofit, irrigation repair and water-heater calls. The report may look good, but the schedule tells the truth.
Educational content can help the right homeowner find those services before a small loss becomes damage. Link fixture and leak guides naturally to the company's service pages, then measure calls and booked jobs. If that path is unclear, a free plumbing SEO audit can identify where qualified traffic is leaking away. For the broader plan, see how plumbing SEO connects service expertise, local visibility and phone-first conversion.
12. Summary table: all 101 water conservation benchmarks
The detailed tables above are the full reference set. This master index shows where each numbered statistic lives, what it covers and which source families carry the evidence.
| Rows | Category | Count | Main source families | Best use |
|---|---|---|---|---|
| 1–12 | Household leaks | 12 | EPA WaterSense statistics and Fix a Leak Week | Diagnostics, repair education and bill-loss context |
| 13–24 | Indoor water use | 12 | EPA WaterSense and Water Research Foundation | Prioritizing indoor fixture work |
| 25–34 | Toilets | 10 | EPA WaterSense and U.S. Department of Energy | Flush-rate and replacement economics |
| 35–50 | Faucets and showers | 16 | EPA WaterSense | Flow-rate, hot-water and utility savings |
| 51–60 | Appliances and hot water | 10 | ENERGY STAR and DOE Energy Saver | Whole-home water and energy planning |
| 61–71 | Outdoor and irrigation | 11 | EPA WaterSense outdoor product pages | Controllers, pressure and sprinkler service |
| 72–85 | National withdrawals | 14 | U.S. Geological Survey | National scale and source context |
| 86–95 | Infrastructure | 10 | EPA needs assessment and ASCE | Utility loss and capital context |
| 96–101 | Housing scale | 6 | U.S. Census Bureau | Retrofit market scale and ownership context |
Methodology and source notes
This article was updated October 3, 2026. It prioritizes original federal agencies and primary research organizations. Each numbered row includes a value, named source, direct source URL and year or scope. Product specifications and consumer guidance are identified as current pages accessed in 2026. Older datasets remain labeled with their actual publication or measurement year.
The 101 count covers the numbered rows only. Headline cards, FAQ answers, visualizations and repeated interpretations do not inflate the count. National scenarios such as “if every home replaced” are labeled as scenarios rather than observed savings. Dollar savings are source estimates, not promises for a particular utility rate or household. Census housing counts describe scale, not fixture condition.
The USGS 2015 compilation remains the latest comprehensive national water-use dataset available for the categories shown. Dynamic drought conditions are intentionally linked to the live U.S. Drought Monitor instead of being frozen as a current national percentage.
- EPA WaterSense Statistics and Facts
- EPA Fix a Leak Week
- EPA How We Use Water
- Water Research Foundation REUWS Version 2
- EPA Residential Toilets
- DOE Toilets and Urinals
- EPA Bathroom Faucets
- EPA Showerheads
- ENERGY STAR Clothes Washers
- ENERGY STAR Dishwashers
- DOE Water Heating
- DOE Tankless Water Heaters
- EPA WaterSense Outdoors
- EPA WaterSense Labeled Controllers
- EPA Spray Sprinkler Bodies
- USGS Estimated Use of Water in the United States in 2015
- EPA 7th Drinking Water Infrastructure Needs Survey and Assessment
- ASCE 2025 Drinking Water Infrastructure
- U.S. Census Bureau 2020 Housing Counts
- U.S. Drought Monitor
- U.S. Bureau of Reclamation Colorado River Basin
Water conservation statistics FAQ
EPA uses 82 gallons per person per day as a broad household benchmark. The Water Research Foundation measured 58.6 gallons per person per day of indoor use in its REUWS Version 2 study homes. The values have different scope, so they should not be treated as a contradiction.
EPA says household leaks can waste nearly one trillion gallons nationally each year. Its published household benchmarks put average leak waste at roughly 9,400 gallons a year, while fixing easy leaks can reduce a home's water bill by about 10%.
WaterSense labeled products are independently certified to use at least 20% less water than standard models while meeting EPA performance criteria. Product-specific limits include 1.28 gallons per flush for toilets, 1.5 gallons per minute for bathroom faucets and 2.0 gallons per minute for showerheads.
In the Water Research Foundation's REUWS Version 2 study, toilets were the largest named category at 24% of indoor use. Showers were 20%, faucets 19% and clothes washers 17%.
EPA estimates that an average family replacing old inefficient toilets with WaterSense models can save about 13,000 gallons and $140 in water costs per year. Actual savings depend on the old fixture, household size and utility rates.
EPA says outdoor use averages about 30% of household water nationally and can reach 60% in arid regions. As much as half of outdoor water can be wasted through inefficient watering methods and systems.
Start with a no-use meter test, visible fixture leaks, toilet dye tests, water pressure, fixture flow or flush labels, hot-water delivery and irrigation faults. Record the baseline, repair or replacement choice and final reading so the customer can see what changed.
Want more qualified plumbing calls?
Get a practical review of your service pages, local visibility, proof, internal links and call path.
Run My Free SEO Leak Check