
- Homeowner demand is broad: 66% of surveyed homeowners experienced summer plumbing issues, and 27.94% of ConsumerAffairs respondents reported plumbing-system repair.
- Leaks are a constant marketing trigger: EPA says average household leaks waste more than 9,300 gallons per year and fixing easy leaks can save about 10% on water bills.
- Cost anxiety is real: 59% of surveyed homeowners delay repairs because they cannot afford them, so plumbing pages need trust, speed, and clear next steps.
Household plumbing repair demand is not abstract. It shows up as weekend water-heater calls, slow drains before guests arrive, silent toilet leaks, sewer backups, and homeowners who know a replacement is coming but keep delaying the appointment. For plumbing companies, those moments are where search visibility, trust, and fast call handling turn into booked jobs.
This benchmark roundup collects more than 70 homeowner demand, repair cost, leak, emergency, and workforce statistics from cited sources. Use it to shape service pages, Google Business Profile updates, seasonal campaigns, technician staffing, and the plumbing SEO content that helps homeowners choose a local plumber before the problem gets worse.
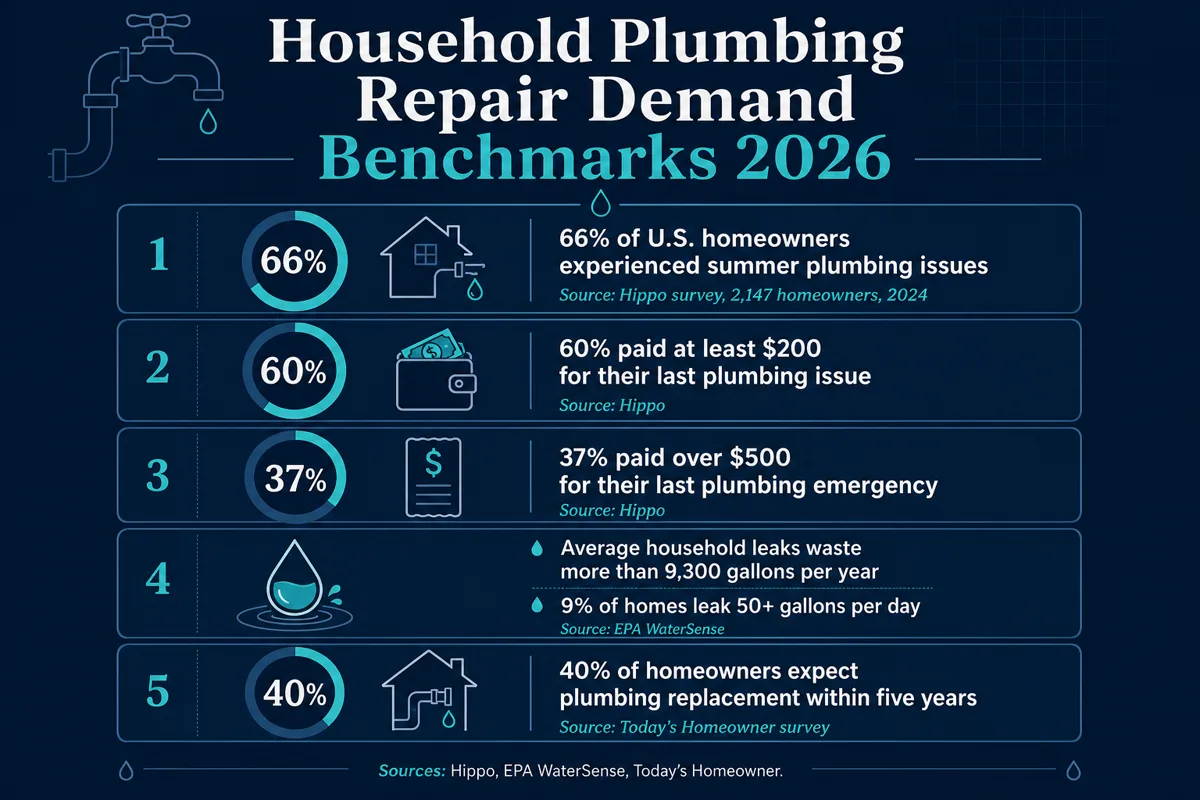
Key Takeaways for Plumbing Owners
- Demand is seasonal and urgent. Hippo found 66% of surveyed homeowners had summer plumbing issues, and 27% reported property damage from those issues.
- Leaks are a constant demand engine. EPA WaterSense says average household leaks waste more than 9,300 gallons per year, while 9% of homes leak 50+ gallons per day.
- Cost anxiety changes conversion. Today’s Homeowner found 59% of homeowners delay repairs because they cannot afford them now, so trust, financing language, and clear estimates matter.
- Emergency pages need phone-first design. Emergency plumbing cost ranges frequently run into hundreds or thousands of dollars, so homeowners compare speed, proof, and availability fast.
- SEO content should mirror real repairs. Use this data to prioritize leak detection, drain cleaning, water heater repair, sewer backup, burst pipe, toilet repair, and replacement planning pages.
Table of Contents
- Homeowner demand and repair frequency
- Leak waste and hidden plumbing problems
- Emergency cost and affordability benchmarks
- Deferred repair and replacement planning
- Local SEO actions for plumbers
- 70+ household plumbing repair benchmarks
- Methodology and source notes
1. Homeowner Demand and Repair Frequency
Plumbing is one of the home systems people notice immediately when it fails. A leaky supply line, a clogged toilet, or a broken water heater interrupts daily life in a way that a cosmetic repair does not. That is why repair-frequency data should influence both service-page structure and dispatch messaging.
Hippo’s homeowner survey found that 66% of U.S. homeowners had experienced a summer plumbing issue. ConsumerAffairs also found plumbing systems were the most-reported repair category in its home-repair survey, with 27.94% of respondents reporting a plumbing repair.
| Demand signal | Benchmark | What it means for plumbers |
|---|---|---|
| Seasonal issue rate | 66% | Build seasonal maintenance, leak, sump pump, and drain-cleaning content before peak weather demand. |
| Reported plumbing repair rate | 27.94% | Plumbing repair deserves dedicated service pages and Google Business Profile service coverage. |
| Routine disruption | 31% | Messaging should promise fast scheduling, clear windows, and cleanup standards. |
| Water bill spike | 29% | Leak-detection pages should mention unexplained water bills as a homeowner symptom. |
2. Leak Waste and Hidden Plumbing Problems
Leaks create a useful marketing bridge between prevention and emergency repair. They are common enough for educational content and expensive enough to justify professional help. EPA WaterSense reports that household leaks can waste nearly one trillion gallons nationwide each year, and that fixing easy leaks can save homeowners about 10% on water bills.
For a local plumbing company, the actionable takeaway is simple: make leak detection easy to find. Add pages and FAQs for toilet leaks, faucet drips, showerhead leaks, irrigation leaks, water-meter tests, and unusually high water bills. Then connect those pages to call tracking so you can see which leak symptoms become booked work.
3. Emergency Cost and Affordability Benchmarks
Repair-cost data explains why homeowners hesitate before calling. Hippo found 60% paid at least $200 for their last plumbing issue and 37% paid over $500 for their last plumbing emergency. Angi reports emergency plumbing services commonly cost $100 to $500 per hour, while HomeGuide lists burst-pipe repairs from $500 to $5,000 and sewer-line emergency repairs from $500 to $3,800.
That does not mean every visitor is shopping only by price. It means the page must reduce fear: show service areas, availability, licenses, review proof, diagnostic expectations, and the difference between a simple clog and a property-damaging emergency.
4. Deferred Repair and Replacement Planning
Deferred maintenance is one of the biggest hidden opportunities. Today’s Homeowner found 82% of U.S. homeowners say at least one area of the home needs maintenance, 59% are putting off repairs because they cannot afford them, and 40% expect plumbing replacement within five years.
That creates a second lane beyond emergency calls: replacement planning. Publish content that helps homeowners understand repiping, water heater replacement, sewer-line replacement, fixture upgrades, financing, and what should be inspected before a small problem becomes a major call.
5. How Plumbing Companies Should Use These Statistics
These benchmarks should change the way a plumber structures local search. Broad articles are useful, but the highest-intent pages usually match specific homeowner symptoms: burst pipe, clogged toilet, sewer backup, water heater leaking, low water pressure, running toilet, dripping faucet, and no hot water.
- Build service pages around high-cost, high-urgency repairs first.
- Add seasonal Google Business Profile posts for summer plumbing issues, freeze risk, leak checks, and water heater maintenance.
- Use review prompts that mention the actual job type, neighborhood, speed, cleanliness, and result.
- Compare call data against pages in plumbing SEO statistics and local SEO for plumbers statistics to decide where content is underperforming.
- Route emergency pages to click-to-call CTAs, not long forms.
6. 70+ Household Plumbing Repair Benchmarks
The table below gives a source-linked reference set for planning content, ads, dispatch scripts, GBP posts, and homeowner education. Each row is tied to a named source so your marketing claims stay grounded.
| Category | Benchmark | Statistic | Source |
|---|---|---|---|
| Demand | 66% | U.S. homeowners who experienced a summer plumbing issue | Hippo |
| Demand | 2,147 | Completed homeowner survey responses behind the Hippo plumbing issue study | Hippo |
| Demand | 27% | Homeowners reporting property damage from summer plumbing problems | Hippo |
| Demand | 29% | Homeowners reporting a spike in water bills after summer plumbing issues | Hippo |
| Demand | 31% | Homeowners reporting routine disruption from summer plumbing issues | Hippo |
| Maintenance | 61% | Homeowners taking at least one proactive summer plumbing maintenance step | Hippo |
| Maintenance | 31% | Preventative homeowners relying on professional inspections | Hippo |
| Maintenance | 30% | Preventative homeowners doing visual leak inspections | Hippo |
| Maintenance | 28% | Preventative homeowners doing regular drain cleaning | Hippo |
| Maintenance | 10%+ | Respondents unsure what summer plumbing maintenance entails | Hippo |
| Maintenance | 65% | Homeowners interested in learning more about heat-related preventative maintenance | Hippo |
| Cost | 60% | Homeowners who paid at least $200 for their last plumbing issue | Hippo |
| Cost | 37% | Homeowners who paid more than $500 for their last plumbing emergency | Hippo |
| Cost | $200-$499 | Most common repair band for homeowners who skipped summer maintenance | Hippo |
| Damage | 55% | Homeowners spending over $3,000 who also reported property damage | Hippo |
| Damage | 47% | Homeowners spending $2,000-$2,999 who reported property damage | Hippo |
| Damage | 40% | Homeowners spending $1,000-$1,999 who reported property damage | Hippo |
| Leak waste | Nearly 1T gallons | Annual U.S. household water waste from leaks | EPA WaterSense |
| Leak waste | 9,300+ gallons | Average yearly water waste from household leaks | EPA WaterSense |
| Leak waste | 9% | Homes with leaks wasting 50 gallons or more per day | EPA WaterSense |
| Leak savings | About 10% | Water bill savings from fixing easily corrected household leaks | EPA WaterSense |
| Leak signal | 12,000 gallons/month | Family-of-four cold-month water use level that may signal serious leaks | EPA WaterSense |
| Leak test | 2 hours | Meter-check window with no water use to detect a likely leak | EPA WaterSense |
| Toilet leak | 10 minutes | Food-coloring toilet tank test window for silent leaks | EPA WaterSense |
| Toilet repair | 5 years | Minimum periodic toilet flapper replacement check mentioned by EPA | EPA WaterSense |
| Faucet leak | 3,000+ gallons/year | Waste from a faucet dripping once per second | EPA WaterSense |
| Shower leak | 500+ gallons/year | Waste from a showerhead leaking 10 drips per minute | EPA WaterSense |
| Irrigation leak | 6,300 gallons/month | Waste from an irrigation leak 1/32 inch in diameter | EPA WaterSense |
| Deferred repair | 82% | U.S. homeowners who say at least one area of the home needs maintenance | Today's Homeowner |
| Deferred repair | 45% | Homeowners with one to two issues needing repair | Today's Homeowner |
| Deferred repair | 30% | Homeowners with three to four issues needing repair | Today's Homeowner |
| Deferred repair | 9% | Homeowners with five or more home issues | Today's Homeowner |
| Deferred repair | 79% | Homeowners planning to address repairs within six months | Today's Homeowner |
| Affordability | 59% | Homeowners delaying repairs because they cannot afford them now | Today's Homeowner |
| Replacement | 40% | Homeowners expecting windows, plumbing, or roof replacement within five years | Today's Homeowner |
| Replacement | 40% | Homeowners specifically expecting plumbing replacement within five years | Today's Homeowner |
| Replacement | 41% | Homeowners expecting window replacement within five years | Today's Homeowner |
| Replacement | 40% | Homeowners expecting roof replacement within five years | Today's Homeowner |
| Replacement | 21% | Homeowners expecting electrical replacement within five years | Today's Homeowner |
| Replacement | 21% | Homeowners expecting HVAC replacement within five years | Today's Homeowner |
| Replacement | 20% | Homeowners expecting driveway replacement within five years | Today's Homeowner |
| Replacement | 18% | Homeowners expecting siding replacement within five years | Today's Homeowner |
| Financing | 46% | Homeowners not considering repair financing until they can fully afford it | Today's Homeowner |
| Financing | 21% | Homeowners expecting to finance repairs with credit cards | Today's Homeowner |
| Financing | 13% | Homeowners expecting to use personal loans for repairs | Today's Homeowner |
| Financing | 13% | Homeowners expecting to use emergency savings for repairs | Today's Homeowner |
| Emergency savings | $1,000 or less | Savings available to 31% of homeowners for home emergencies | Today's Homeowner |
| Emergency savings | 11% | Homeowners with no money set aside for a home repair emergency | Today's Homeowner |
| Repair frequency | 27.94% | Survey respondents reporting a plumbing-system repair | ConsumerAffairs |
| Repair frequency | 23.67% | Survey respondents reporting air-conditioning repair, the next-highest category | ConsumerAffairs |
| Repair frequency | 22.77% | Survey respondents reporting refrigerator repair | ConsumerAffairs |
| Repair frequency | 20.44% | Survey respondents reporting heating-system repair | ConsumerAffairs |
| Repair frequency | 18.89% | Survey respondents reporting smoke-detector repair | ConsumerAffairs |
| Survey base | 773 | Consumers surveyed in the ConsumerAffairs home-repair study | ConsumerAffairs |
| State signal | 36% | Major home repairs in Michigan survey responses that were plumbing-related | ConsumerAffairs |
| Risk model | 50% | Weight ConsumerAffairs assigned to reported plumbing repairs in its state ranking | ConsumerAffairs |
| Risk model | 25% | Weight assigned to tap-water quality in the ConsumerAffairs plumbing ranking | ConsumerAffairs |
| Risk model | 25% | Weight assigned to flooding risk in the ConsumerAffairs plumbing ranking | ConsumerAffairs |
| Emergency hourly | $100-$500/hr | Common emergency plumbing hourly range | Angi |
| Emergency hourly | $170/hr | Average emergency plumber hourly cost reported by Angi | Angi |
| Regular hourly | $40-$200/hr | Typical plumber hourly cost range before emergency multipliers | Angi |
| Multiplier | 1.5x-3x | Emergency plumber cost multiplier for timing and urgency | Angi |
| After-hours | $60-$300/hr | Angi weekday evening emergency range | Angi |
| Weekend | $80-$400/hr | Angi weekend emergency range | Angi |
| Holiday | $120-$600/hr | Angi holiday emergency range | Angi |
| Emergency hourly | $100-$350/hr | HomeGuide average emergency plumber hourly range | HomeGuide |
| Service call | $150-$250 | Common non-business-hours service call fee or surcharge | HomeGuide |
| Burst pipe | $500-$5,000 | Emergency burst or leaking pipe repair range | HomeGuide |
| Clogged drain | $300-$800 | Simple outside-hours drain or toilet clog range | HomeGuide |
| Hydro jetting | $600-$1,600+ | Severe clog range when hydro jetting is needed | HomeGuide |
| Water heater | $150-$750+ | Emergency water heater repair range | HomeGuide |
| Tank heater | $800-$3,000+ | Standard tank water heater replacement range | HomeGuide |
| Sewer backup | $500-$3,800 | Emergency sewer-line repair range | HomeGuide |
| Gas line | $350-$2,000 | Emergency gas-line repair range for a single appliance | HomeGuide |
| Workforce | 504,500 | U.S. plumber, pipefitter, and steamfitter jobs in 2024 | BLS |
| Workforce | 44,000/year | Projected annual plumber, pipefitter, and steamfitter openings | BLS |
| Workforce | 4% | Projected 2024-2034 employment growth for plumbers, pipefitters, and steamfitters | BLS |
| Workforce | 22,700 | Projected 2024-2034 employment change | BLS |
| Workforce | $62,970 | Median annual wage for plumbers, pipefitters, and steamfitters in May 2024 | BLS |
| Housing data | ACS | Census ACS plumbing-facilities questions support housing assistance planning statistics | U.S. Census |
7. Methodology and Source Notes
This roundup uses public agency pages, named homeowner surveys, and cost guides with direct source links. Source pages were reviewed for extractable homeowner-demand, cost, leak, replacement, and labor-market benchmarks. PlumbingSEO.agency did not estimate unnamed percentages or invent unavailable survey breakouts.
When using this data in your own marketing, keep the source context intact. A national homeowner survey is useful for content strategy, but your local call tracking, Google Business Profile data, booked-job categories, and close rates should decide which pages get built first.
Household Plumbing Repair Statistics FAQ
The strongest demand signals are homeowner plumbing issue frequency, leak waste, emergency costs, deferred repairs, and replacement timing. The article highlights 66% of surveyed homeowners experiencing summer plumbing issues, 60% paying at least $200 for the last issue, EPA leak-waste benchmarks, and 40% expecting plumbing replacement within five years.
Use the numbers to prioritize service pages, seasonal content, Google Business Profile posts, review requests, and call tracking around the problems homeowners actually feel: leaks, clogged drains, water heaters, emergency calls, sewer backups, and replacement planning.
Start with original public agencies and named survey publishers. This article cites EPA WaterSense, the U.S. Bureau of Labor Statistics, the U.S. Census, Hippo, Today’s Homeowner, ConsumerAffairs, Angi, and HomeGuide, with links back to each source.
No. Repair statistics show homeowner need and message-market fit. A plumbing company still needs local keyword research, call tracking, Google Business Profile performance, and service-area conversion data to turn that demand into booked work.
Emergency cost ranges help owners decide which calls deserve fast landing pages, after-hours messaging, financing language, and stronger trust proof. High-stress repair categories need clear availability, reviews, location coverage, and phone-first conversion paths.
Want More Plumbing Calls From Real Repair Demand?
We will review your service pages, Google Business Profile, call tracking, and local competitors, then show which repair categories should get fixed first.
Run My Free SEO Leak Check