
- The network is enormous: more than 16,000 treatment plants connect to roughly 800,000 miles of public sewers and 500,000 miles of private laterals.
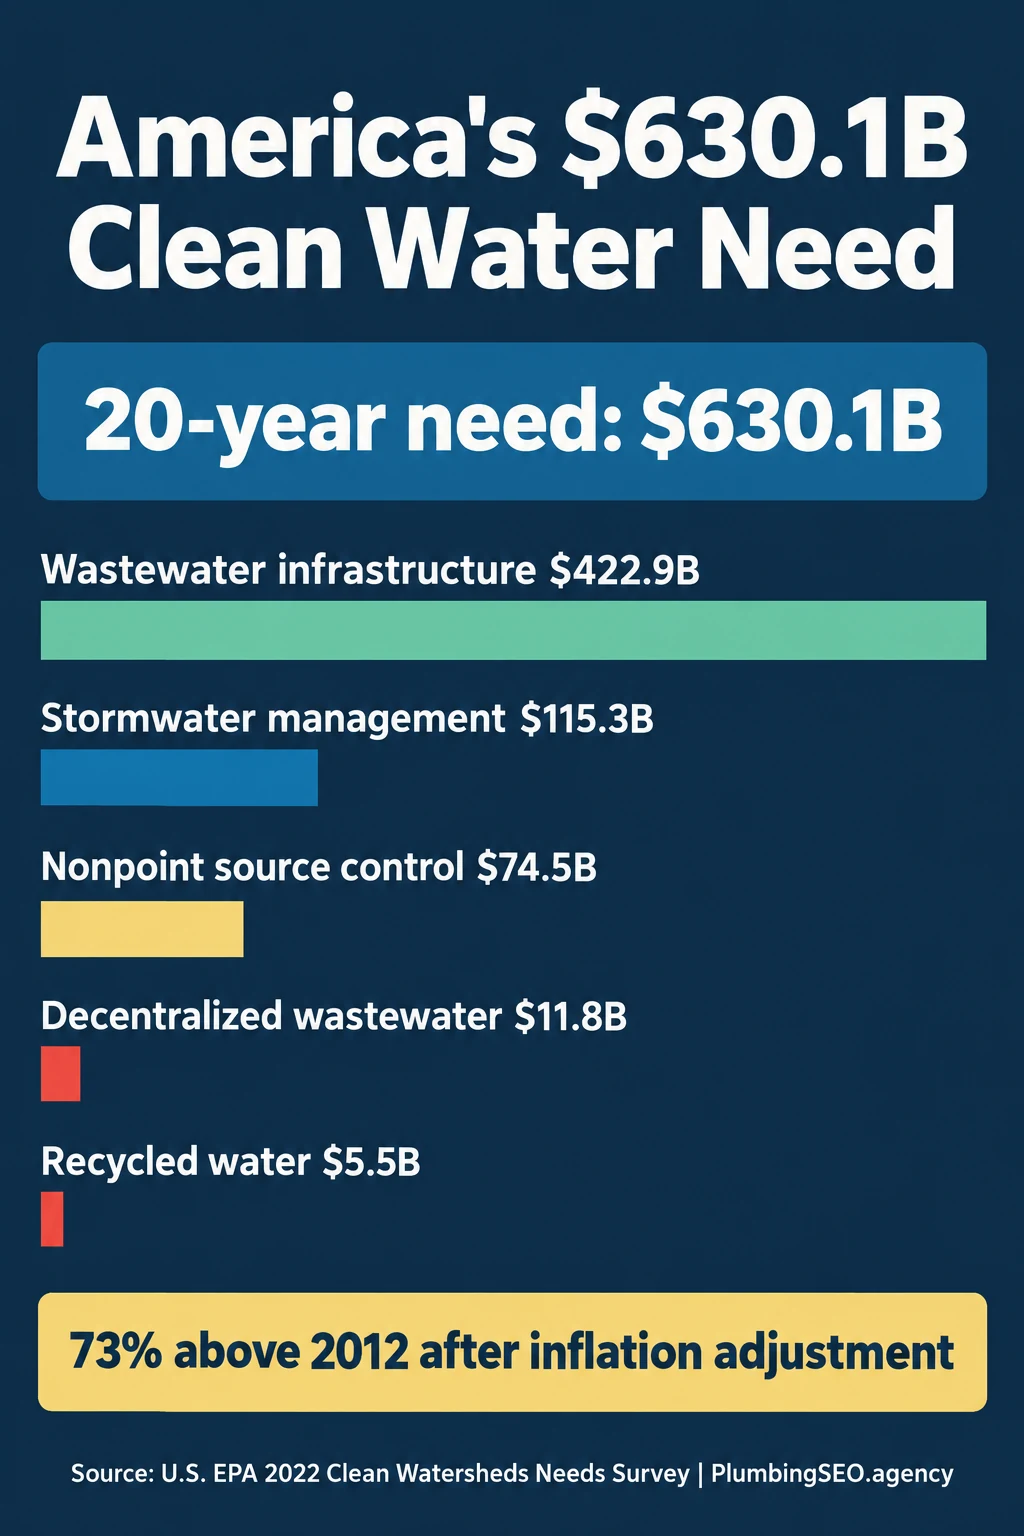
- The reinvestment bill is bigger: the 2022 Clean Watersheds Needs Survey documented $630.1 billion in eligible clean-water needs over 20 years, including $422.9 billion for wastewater infrastructure.
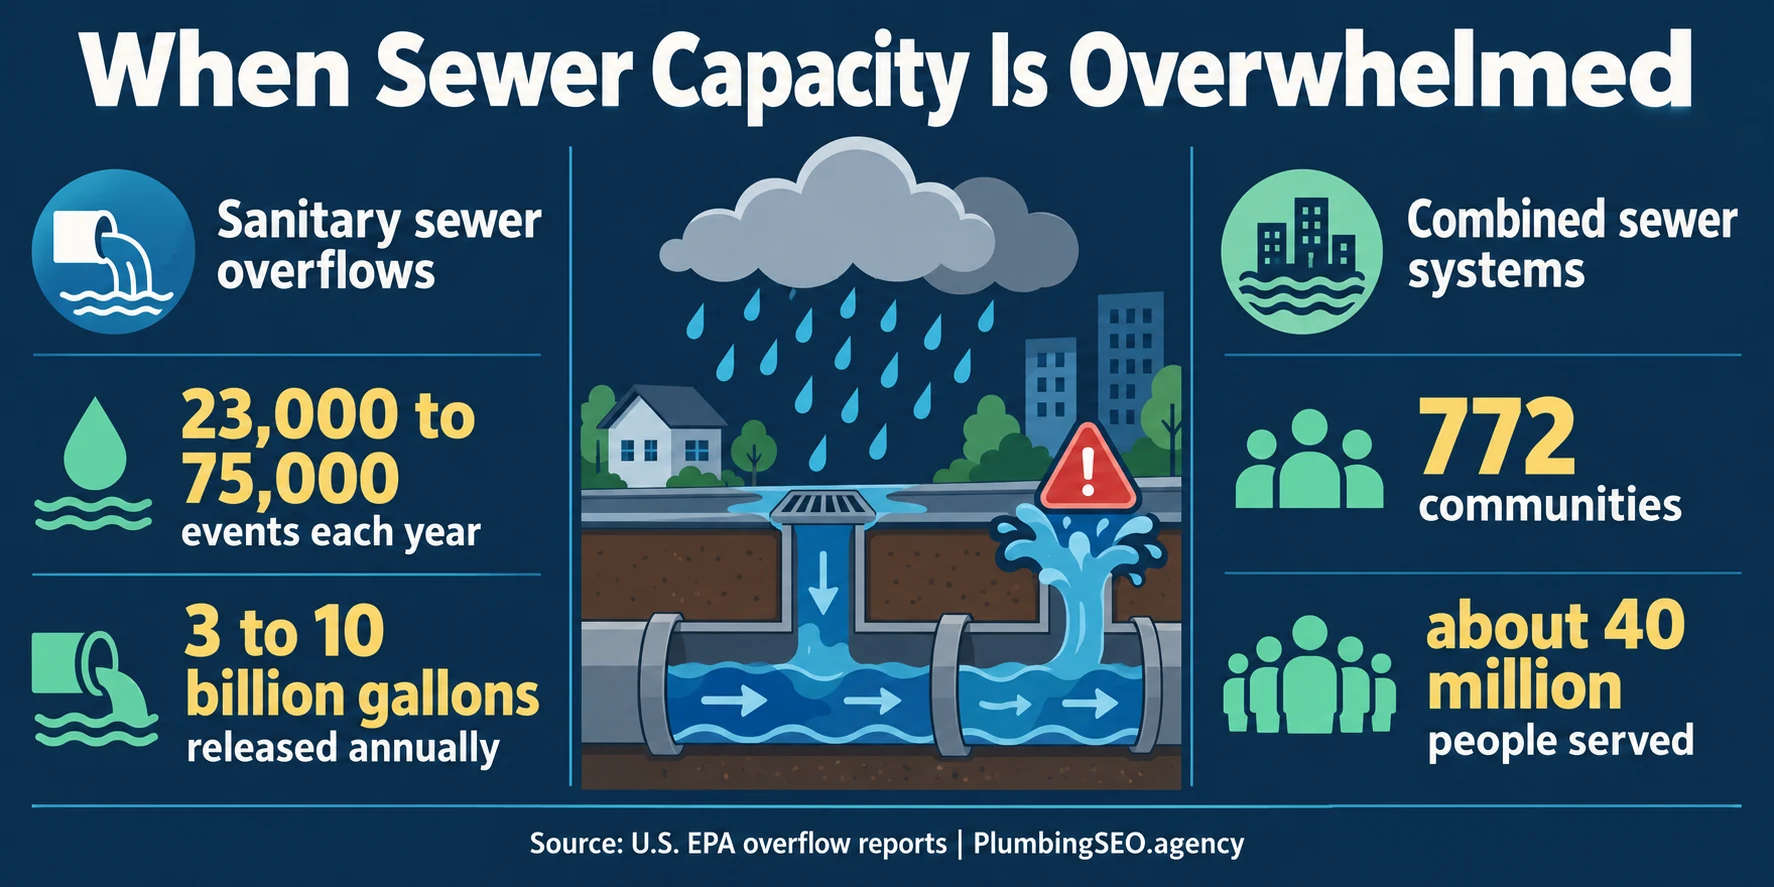
- Overflows are not rare edge cases: EPA's long-standing national estimate puts sanitary sewer overflows at 23,000 to 75,000 events per year, releasing an estimated 3 to 10 billion gallons.
- Service demand has two engines: aging public assets create rehabilitation work while household lines, septic systems, clogs, roots, and emergency backups keep local drain and sewer crews busy.
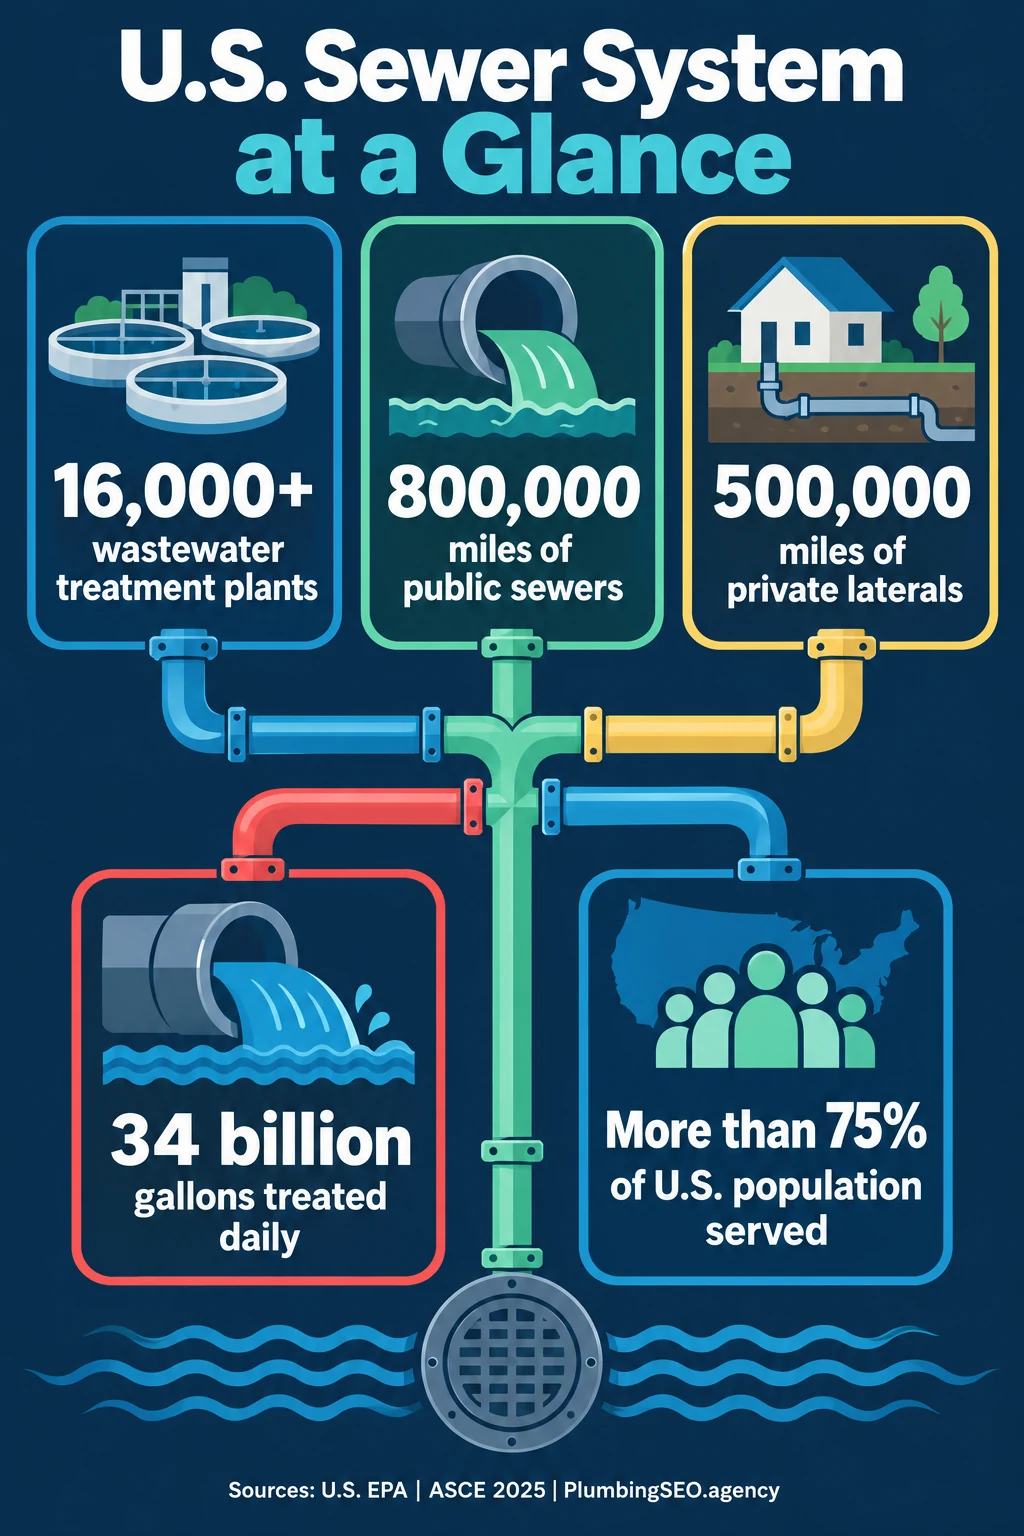
A sewer backup at one house and a billion-gallon municipal treatment system look like different worlds. They are connected by the same basic job: move wastewater reliably, keep stormwater where it belongs, find defects before they become failures, and restore flow when something goes wrong.
This guide collects 91 numbered sewer and drain benchmarks from federal agencies, infrastructure reports, municipal utilities, cost publishers and the U.S. Bureau of Labor Statistics. It separates national infrastructure figures from utility-specific examples and consumer cost ranges. That distinction matters. A capacity number from New York City is not a national average, and a cost guide is not a quote for a buried line under a particular driveway.
For plumbing company owners, the data helps explain why sewer and drain work remains a durable service category. For researchers and writers, it provides a source-cited starting point. For homeowners, it puts the size of the hidden system into perspective without pretending every clog is a collapsed main.
How to read sewer and drain statistics without mixing unlike data
Sewer statistics are unusually easy to misuse because the boundaries change. “Sewer miles” may mean public gravity mains, regional interceptors, force mains, private laterals or some combination. “Treatment capacity” may mean normal dry-weather flow, design capacity or a short wet-weather peak. “Repair cost” changes with depth, length, pipe material, access, excavation, permits and surface restoration.
The publication year also needs context. EPA's 2022 needs survey is the latest comprehensive survey dataset in this roundup, while the agency's frequently cited sanitary-overflow range comes from an older national report. We retain older figures only when the source remains the primary public reference and label them rather than dressing them up as fresh 2026 measurements.
1. U.S. sewer system size and treatment statistics
Most Americans served by centralized wastewater infrastructure never see the network beneath them. EPA and ASCE describe a system with tens of thousands of facilities and more than a million combined miles of public sewers and private laterals. The line between public and private ownership is commercially important: a city may maintain the main, while a property owner remains responsible for the lateral connecting the building to it.
| # | National benchmark | Value | Source | Scope note |
|---|---|---|---|---|
| 1 | Publicly owned wastewater treatment plants | 16,000+ | U.S. EPA, municipal wastewater | Centralized public treatment facilities |
| 2 | Wastewater treated by those systems | About 34 billion gal/day | U.S. EPA | National daily volume |
| 3 | U.S. population served by centralized collection and treatment | More than 75% | U.S. EPA | Population share, not household count |
| 4 | Public sewer pipe | About 800,000 miles | ASCE 2025 | Public collection network |
| 5 | Private sewer laterals | About 500,000 miles | ASCE 2025 | Private connections to public mains |
| 6 | Total public sewer and private lateral mileage represented by those estimates | About 1.3 million miles | ASCE 2025 | Combined rounded figures |
| 7 | Wastewater infrastructure grade | D+ | ASCE 2025 | National infrastructure assessment |
| 8 | U.S. homes using septic systems | More than 1 in 5 | U.S. EPA | Decentralized systems |
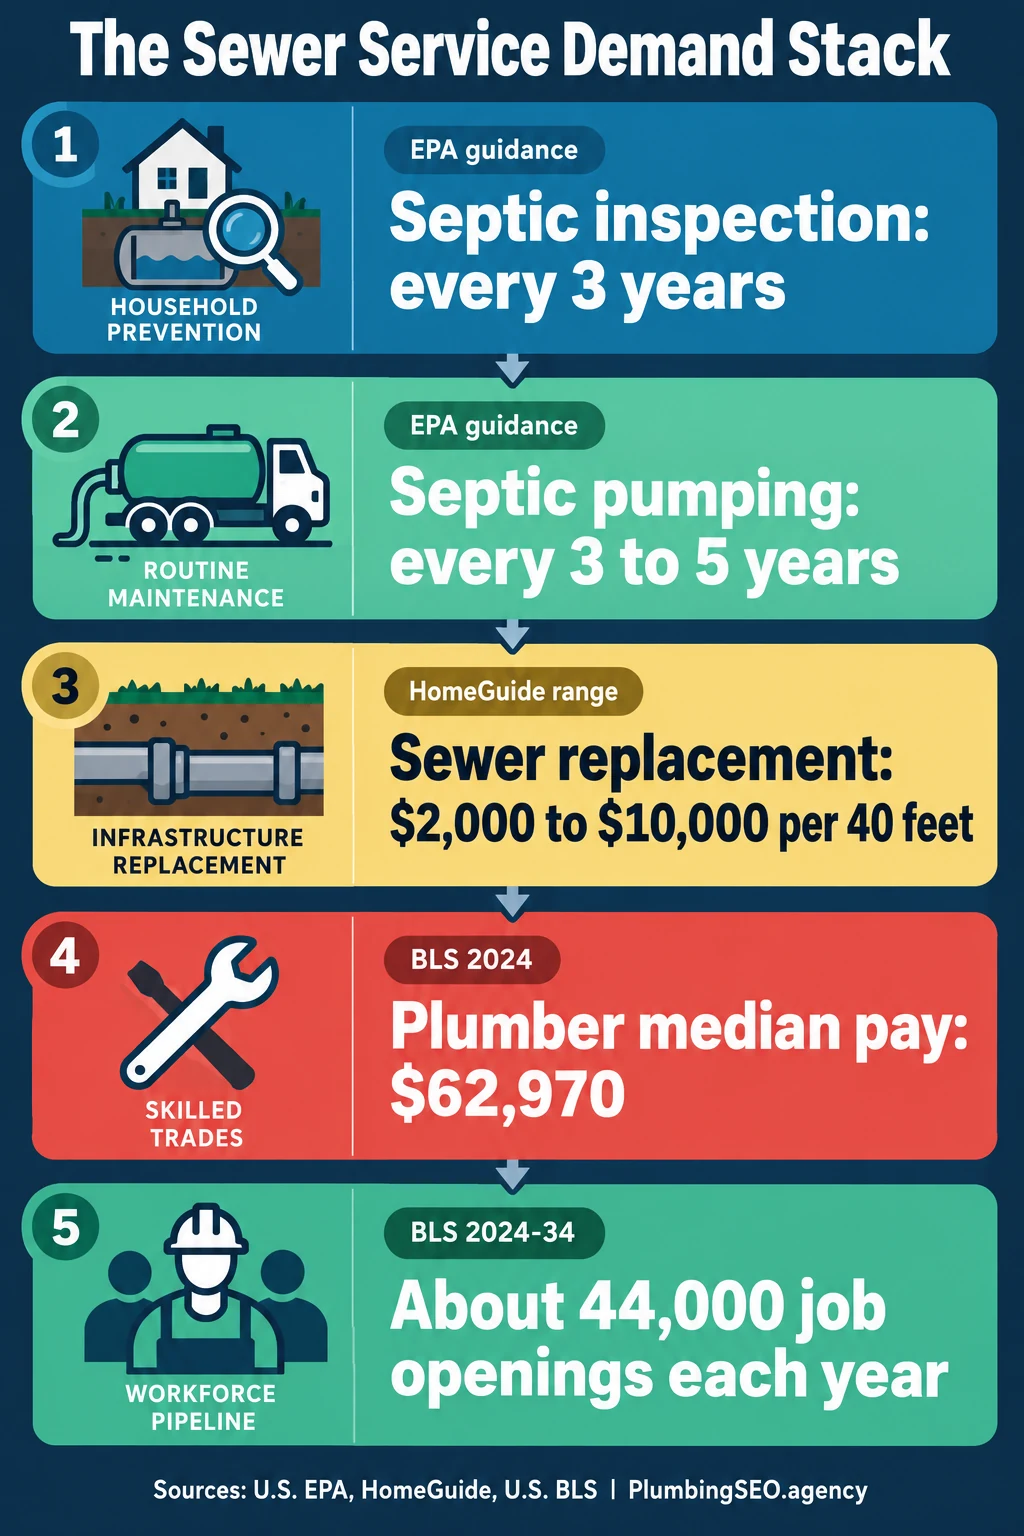
| 9 | Recommended professional septic inspection interval | At least every 3 years | U.S. EPA | General household guidance |
| 10 | Typical septic tank pumping interval | Every 3–5 years | U.S. EPA | Actual interval varies by use and tank size |
| 11 | Typical conventional septic system major components | 2 | U.S. EPA | Septic tank plus drainfield |
| 12 | Major centralized wastewater stages commonly described by EPA | 3 | U.S. EPA | Collection, treatment and discharge/reuse context |
The public-versus-private split helps explain why sewer work remains local even when the infrastructure conversation sounds national. Municipal capital programs address plants, interceptors and public mains. Local plumbing and drain companies diagnose laterals, clean stoppages, inspect lines, repair defects and help property owners understand where responsibility changes.
2. Wastewater infrastructure needs and funding statistics
EPA's Clean Watersheds Needs Survey is the broadest recurring inventory in this guide. States and territories document eligible capital needs for wastewater, stormwater, nonpoint-source controls, decentralized systems and water reuse. The 2022 survey does not say the country will spend $630.1 billion automatically. It says respondents documented that scale of eligible need across a 20-year horizon.
| # | Investment benchmark | Value | Source | Interpretation |
|---|---|---|---|---|
| 13 | Total documented clean-water infrastructure need | $630.1 billion | EPA CWNS 2022 | Eligible need, not appropriated spending |
| 14 | Survey planning horizon | 20 years | EPA CWNS 2022 | Capital needs period |
| 15 | Increase from the 2012 survey after inflation adjustment | 73% | EPA, 2024 release | Ten-year survey comparison |
| 16 | Wastewater infrastructure need | $422.9 billion | EPA CWNS 2022 | Largest category |
| 17 | Stormwater management need | $115.3 billion | EPA CWNS 2022 | Municipal stormwater category |
| 18 | Nonpoint-source pollution control need | $74.5 billion | EPA CWNS 2022 | Runoff and diffuse-source controls |
| 19 | Decentralized wastewater treatment need | $11.8 billion | EPA CWNS 2022 | Includes septic and clustered systems |
| 20 | Recycled-water need | $5.5 billion | EPA CWNS 2022 | Water reuse category |
| 21 | Years between the two survey baselines compared by EPA | 10 years | EPA, 2024 | 2012 to 2022 |
| 22 | Bipartisan Infrastructure Law supplemental CWSRF funding | $11.7 billion | U.S. EPA | Five-year supplemental appropriation |
| 23 | Supplemental CWSRF funding for emerging contaminants | $1 billion | U.S. EPA | BIL program funding |
| 24 | Emerging-contaminant capitalization grant share required as grants or principal forgiveness | 100% | U.S. EPA | Additional subsidy requirement |
| 25 | CWSRF program operations began | 1988 | U.S. EPA | Federal-state financing partnership |
| 26 | State and territorial CWSRF programs | 51 | U.S. EPA | All 50 states plus Puerto Rico |
| 27 | Cumulative CWSRF assistance | More than $172 billion | U.S. EPA program results | Program-life total reported by EPA |
| 28 | Cumulative CWSRF assistance agreements | More than 46,000 | U.S. EPA program results | Loans and other assistance |
These figures point to sustained construction, inspection and rehabilitation demand, but not every federal dollar becomes a local residential sewer call. Contractors should distinguish public procurement opportunities from homeowner service demand. The overlap appears when utilities require lateral work, inflow-and-infiltration corrections, connection changes or property restoration as part of a larger program.
3. Sanitary sewer overflow and combined sewer statistics
Sanitary sewer overflows and combined sewer overflows are related but different. An SSO releases wastewater from a system designed to carry sanitary flow. A CSO is a permitted wet-weather discharge from an older system built to carry sewage and stormwater in one pipe. Rain, infiltration, inflow, blockages, mechanical failures and undersized assets can all contribute, but the regulatory and engineering context differs.
| # | Overflow benchmark | Value | Source | Caveat |
|---|---|---|---|---|
| 29 | Estimated sanitary sewer overflow events | 23,000–75,000/year | U.S. EPA | Long-standing national estimate |
| 30 | Estimated wastewater released through SSOs | 3–10 billion gal/year | U.S. EPA | Excludes basement backups |
| 31 | Communities with combined sewer systems | 772 | U.S. EPA | Primarily older communities |
| 32 | People served by combined sewer systems | About 40 million | U.S. EPA | Population estimate |
| 33 | EPA's major SSO cause groups listed on its overview | 6 | U.S. EPA | Blockages, breaks, defects, power/mechanical failure, inflow/infiltration and capacity |
| 34 | National CSO Control Policy publication year | 1994 | U.S. EPA | Federal control framework |
| 35 | Minimum controls in the CSO Control Policy | 9 | U.S. EPA | Operational and maintenance controls |
| 36 | Primary system types compared here | 2 | U.S. EPA | Separate sanitary and combined systems |
For a drain contractor, the practical lesson is diagnosis before assumption. A backed-up fixture may point to a building drain, a private lateral, a public main or wet-weather capacity. Camera inspection, cleanout access, flow testing and clear documentation help separate those paths. Marketing every backup as a replacement opportunity is not just unhelpful; it weakens trust in a category where customers are already worried about a large bill.
4. Big-city sewer and wastewater system benchmarks
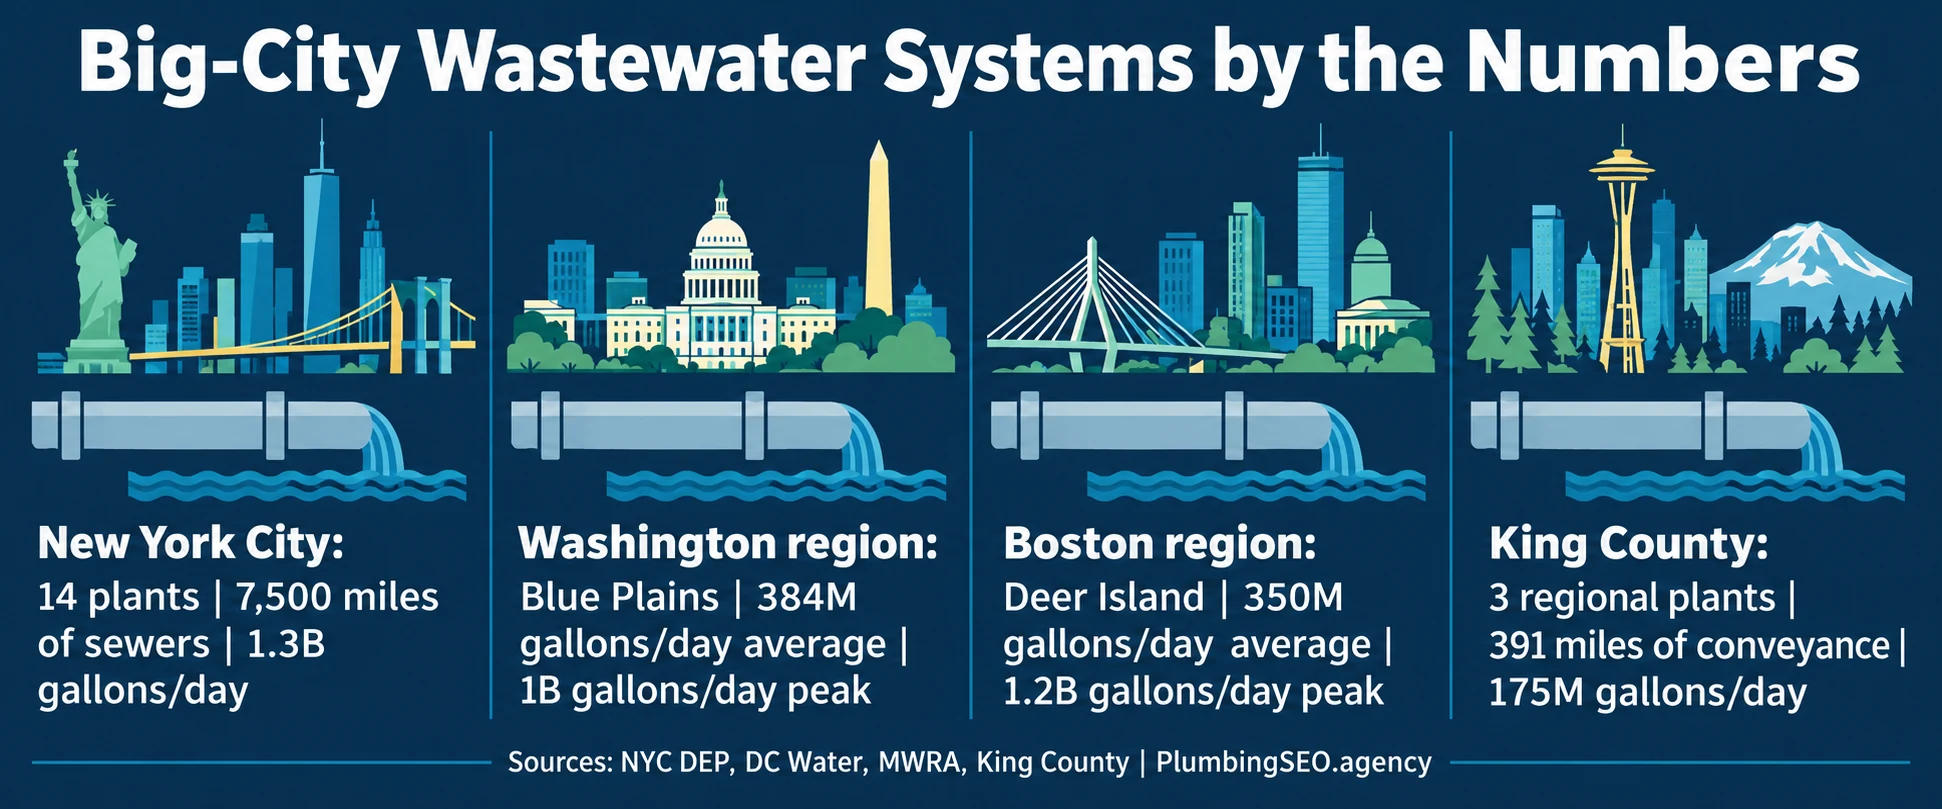
National totals can feel abstract, so this section uses named systems to show operational scale. These are not rankings and should not be averaged together. The agencies use different boundaries and definitions: New York reports city sewers, DC Water operates a regional plant, MWRA serves a multi-community region, King County owns regional conveyance, and Chicago's MWRD covers a large service district.
| # | Named-system benchmark | Value | Source | System scope |
|---|---|---|---|---|
| 37 | New York City wastewater treatment plants | 14 | NYC DEP | City system |
| 38 | New York City sewer network | About 7,500 miles | NYC DEP | Combined and sanitary sewers |
| 39 | New York City wastewater treated on an average dry day | About 1.3 billion gal | NYC DEP | Average dry-weather flow |
| 40 | People served by New York City's wastewater system | About 8.5 million | NYC DEP | Residents |
| 41 | Blue Plains average treatment capacity | 384 million gal/day | DC Water | Advanced wastewater treatment plant |
| 42 | Blue Plains peak treatment capacity | More than 1 billion gal/day | DC Water | Peak wet-weather context |
| 43 | Population served by Blue Plains | More than 2 million | DC Water | Regional service population |
| 44 | Blue Plains original opening year | 1937 | DC Water | Plant operating history |
| 45 | Blue Plains site area | About 150 acres | DC Water | Plant footprint |
| 46 | Deer Island average daily flow | About 350 million gal/day | MWRA | Boston regional system |
| 47 | Deer Island peak hydraulic capacity | 1.2 billion gal/day | MWRA | Peak plant capacity |
| 48 | People served by MWRA wastewater services | About 2.3 million | MWRA | Regional population |
| 49 | Communities served by MWRA wastewater services | 43 | MWRA | Member communities |
| 50 | Deer Island outfall tunnel length | 9.5 miles | MWRA | Treated-effluent outfall |
| 51 | King County regional treatment plants | 3 | King County | Regional plants |
| 52 | King County wet-weather treatment facilities | 2 | King County | Additional wet-weather facilities |
| 53 | King County regional conveyance pipe | About 391 miles | King County | County-owned regional network |
| 54 | King County wastewater pump stations | 47 | King County | Regional system |
| 55 | King County average wastewater treatment | About 175 million gal/day | King County | Typical daily volume |
| 56 | People served by King County wastewater treatment | About 2 million | King County | Regional population |
| 57 | Local sewer agencies connected to King County | 34 | King County | Wholesale agency partners |
| 58 | MWRD Chicago wastewater treatment plants | 7 | MWRD | District facilities |
| 59 | MWRD intercepting sewers and force mains | About 560 miles | MWRD | Regional infrastructure |
| 60 | MWRD pumping stations | 23 | MWRD | Regional system |
| 61 | Population-equivalent wastewater load served by MWRD | About 10.35 million | MWRD | Residents plus industrial load expressed as population equivalent |
| 62 | MWRD service area | About 882.1 sq. miles | MWRD | Cook County district area |
| 63 | Stickney Water Reclamation Plant treatment capacity | 1.44 billion gal/day | MWRD | Design treatment capacity |
| 64 | Los Angeles sewer network | More than 6,700 miles | LA Sanitation | City collection system |
| 65 | Los Angeles wastewater treatment and water reclamation plants | 4 | LA Sanitation | City-operated facilities |
| 66 | Hyperion Water Reclamation Plant design capacity | 450 million gal/day | LA Sanitation | Plant design flow |
| 67 | Hyperion service population | About 4 million | LA Sanitation | Los Angeles and contract cities |
| 68 | Hyperion site area | 144 acres | LA Sanitation | Plant footprint |
One pattern stands out: dry-weather flow and peak wet-weather capability can differ dramatically. That is why a single “gallons per day” figure can mislead without a label. At the property level, the same discipline applies. A line that carries normal household use may still fail under infiltration, grease, roots, a belly or a partial collapse.
5. Household sewer service, drain cleaning and repair cost benchmarks
Cost data is where readers need the most caution. National publishers aggregate estimates across many markets and job types. A shallow accessible spot repair is not comparable with a deep replacement under pavement. Trenchless methods can reduce surface disruption, but inspection, cleaning, access pits, pipe condition and restoration still affect the final scope.
| # | Household or service benchmark | Value | Source | Use carefully |
|---|---|---|---|---|
| 69 | Common sewer line replacement range reported by Angi | $1,388–$5,323 | Angi, 2026 | Consumer-project range |
| 70 | HomeGuide replacement range for a 40-foot line | $2,000–$10,000 | HomeGuide | Length-specific national guide |
| 71 | Line length attached to that HomeGuide range | 40 feet | HomeGuide | Do not quote without the length |
| 72 | Sewer line replacement unit-cost range | $50–$250/linear ft | HomeGuide | Access and method change cost |
| 73 | Typical hydro jetting visit range | $350–$600 | Angi, 2026 | Typical published range |
| 74 | Average hydro jetting price in Angi's guide | About $475 | Angi, 2026 | Publisher average, not a local quote |
| 75 | Broader hydro jetting range | $100–$2,000 | Angi, 2026 | Reflects simple through complex work |
| 76 | Sewer camera inspection cost range | $125–$500 | HomeGuide | National consumer guide |
| 77 | Main sewer line clog clearing range | $175–$800 | HomeGuide | Method and access matter |
| 78 | Drain snaking range | $100–$275 | Angi | Typical consumer range |
| 79 | Recommended septic inspection frequency restated for household planning | 1 inspection/3 years | U.S. EPA | More frequent for some systems |
| 80 | Recommended septic pumping window restated for household planning | 3–5 years | U.S. EPA | Household size and solids affect interval |
A useful service page should explain what changes the price instead of publishing one bait number. Depth, footage, cleanout access, camera findings, pipe diameter and material, excavation, lining or bursting suitability, permits, traffic control, landscaping and hardscape restoration all belong in the conversation. Our sewer repair SEO guide explains how to turn that diagnostic path into content without promising replacement before inspection.
Drain cleaning and sewer repair also should not be collapsed into one service. A stoppage may be cleared with a cable or jetter. Repeated stoppages may justify a camera inspection. An offset, collapse or severe deformation may require structural repair. Clear service definitions help customers choose the right next step and help search engines understand the difference between drain cleaning, hydro jetting and trenchless sewer work.
6. Plumber workforce and service-capacity statistics
Demand is not only a pipe question. It is a labor-capacity question. The Bureau of Labor Statistics groups plumbers, pipefitters and steamfitters in one occupation, so these figures are broader than residential drain technicians alone. They still show the hiring environment facing contractors that want to add inspection, jetting, excavation or lining crews.
| # | Workforce benchmark | Value | Source | Scope |
|---|---|---|---|---|
| 81 | Plumber, pipefitter and steamfitter jobs | 504,500 | U.S. BLS, 2024 | National employment |
| 82 | Projected employment growth | 4% | U.S. BLS, 2024–34 | About as fast as average |
| 83 | Projected openings each year | About 44,000 | U.S. BLS, 2024–34 | Growth plus replacement needs |
| 84 | Median annual pay | $62,970 | U.S. BLS, May 2024 | Occupation-wide median |
| 85 | Median hourly pay | $30.27 | U.S. BLS, May 2024 | Occupation-wide median |
| 86 | Lowest 10% annual pay | Less than $40,670 | U.S. BLS, May 2024 | National wage distribution |
| 87 | Highest 10% annual pay | More than $105,150 | U.S. BLS, May 2024 | National wage distribution |
| 88 | Typical apprenticeship duration | 4 or 5 years | U.S. BLS | Common training pathway |
| 89 | Employment in plumbing, heating and air-conditioning contractors | 66% | U.S. BLS, 2024 | Largest employer group |
| 90 | Self-employed workers | 8% | U.S. BLS, 2024 | Occupation employment share |
| 91 | Employment in heavy and civil engineering construction | 4% | U.S. BLS, 2024 | Infrastructure-related employer group |
A company can rank for sewer replacement and still fail to serve demand if it lacks camera equipment, trained technicians, excavation partners, permits, estimating discipline or a phone team that can identify urgency. Marketing capacity should follow operating capacity. The most profitable keyword is useless when the schedule, service area or crew qualifications cannot support the job.
What sewer and drain companies should do with these benchmarks
Do not turn 91 statistics into 91 marketing claims. Use the data to improve service design, customer education and measurement.
1Separate the service paths
Create clear paths for drain cleaning, camera inspection, hydro jetting, sewer repair and trenchless methods. Explain when one step leads to another.
2Sell diagnosis first
Use inspection evidence, access conditions and pipe defects to justify scope. Avoid implying that every recurring clog needs replacement.
3Label every cost range
Attach footage, method, year, geography and exclusions. Then explain permits, restoration, depth and access rather than hiding them.
4Build wet-weather readiness
Track storm-driven call patterns, answer-rate pressure, after-hours dispatch and which neighborhoods produce backups during heavy rain.
5Show real capability
Publish camera footage examples, clean equipment photos, crew qualifications, repair options and post-job restoration—without exposing customer data.
6Measure booked jobs
Separate clog calls, inspections, jetting, spot repairs, lining, bursting and replacements. Rankings alone cannot show which work reaches the schedule.
For a broader organic growth plan, connect these pages to your main plumbing SEO services page and to the areas you actually serve. If the site is not producing qualified sewer calls, a free plumbing SEO audit can identify crawl, local visibility, content and conversion leaks before you publish another generic post.
Methodology and source notes
This article was updated October 3, 2026. It uses federal agency pages and reports, infrastructure assessments, official municipal utility pages, national consumer cost guides and the Bureau of Labor Statistics. Numbered rows preserve each source's scope. Rounded values remain rounded. Municipal figures are named case examples, not national averages. Cost ranges are planning context, not estimates for a specific property.
The five editorial infographics were generated specifically for this article and checked against the corresponding source values. Statistics repeated for a different operational use—such as septic intervals in both system and household sections—are identified as restatements rather than presented as independent evidence. No universal “average sewer company revenue” or unsupported market-size claim was included.
- U.S. EPA Municipal Wastewater
- ASCE 2025 Wastewater Report Card
- EPA 2022 Clean Watersheds Needs Survey
- EPA Clean Water State Revolving Fund
- EPA Sanitary Sewer Overflows
- EPA Combined Sewer Overflows
- EPA Septic System Care
- New York City DEP
- DC Water Blue Plains
- Massachusetts Water Resources Authority
- King County Wastewater Treatment
- Metropolitan Water Reclamation District of Greater Chicago
- LA Sanitation
- HomeGuide Sewer Line Cost Guide
- Angi Hydro Jetting Cost Guide
- U.S. BLS Occupational Outlook Handbook
Frequently asked questions about sewer and drain statistics
ASCE's 2025 wastewater assessment cites about 800,000 miles of public sewers and another 500,000 miles of private laterals. Together, those rounded estimates represent roughly 1.3 million miles, but public and private maintenance responsibility differs.
EPA says more than 16,000 publicly owned treatment plants treat about 34 billion gallons of wastewater per day and serve more than 75% of the U.S. population.
EPA's 2022 Clean Watersheds Needs Survey documented $630.1 billion in eligible clean-water infrastructure needs over 20 years. Wastewater infrastructure accounted for $422.9 billion of that total.
EPA's long-standing national estimate is 23,000 to 75,000 sanitary sewer overflow events per year, releasing an estimated 3 to 10 billion gallons. EPA notes that this volume estimate excludes sewage backups into buildings.
Published national guides vary. Angi lists a common range of $1,388 to $5,323, while HomeGuide lists $2,000 to $10,000 for 40 feet and $50 to $250 per linear foot. A camera inspection and site-specific estimate are more useful because depth, access, method, permits and restoration can change the price substantially.
EPA generally recommends a professional inspection at least every three years and pumping every three to five years. Alternative systems may need more frequent attention, and the correct interval depends on household size, tank size, solids and water use.
Want more qualified sewer and drain calls?
Get a practical review of your service pages, Maps visibility, local proof, internal links and call path.
Run My Free SEO Leak Check