
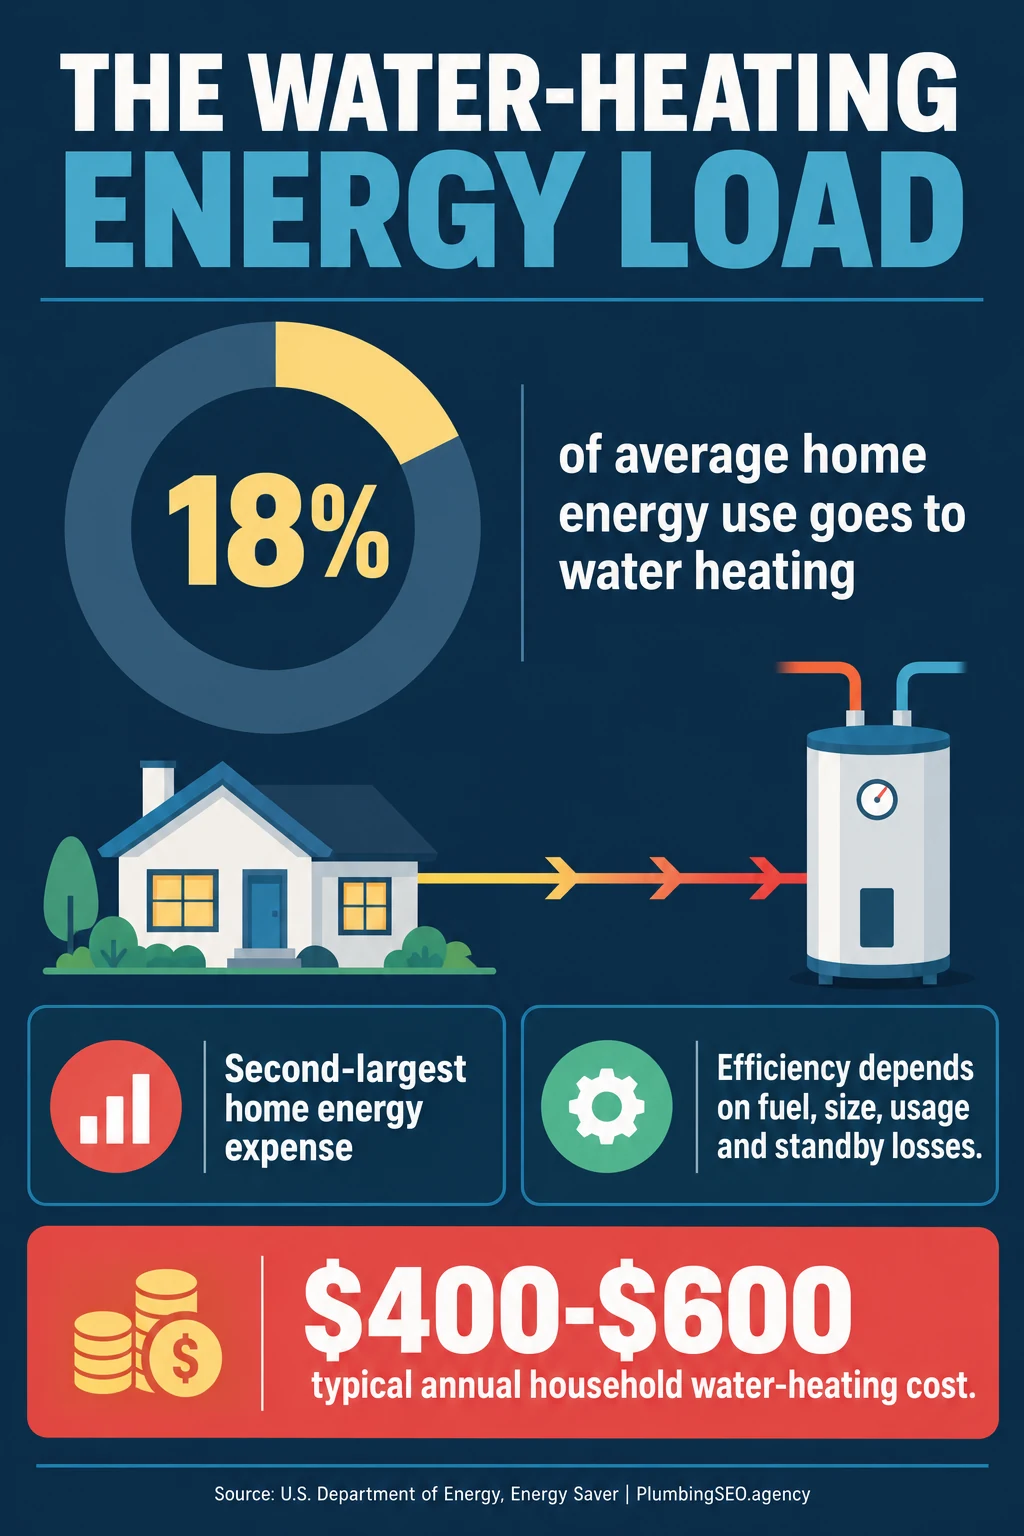
- Water heating is a major household load: DOE puts it near 18% of home energy use and $400–$600 in typical annual household cost.
- Technology changes the service conversation: demand heaters reward lower daily use, while heat-pump models can use two to three times less energy than conventional electric resistance units.
- The replacement window is structural: tens of millions of U.S. homes use gas or electric water heating, storage tanks commonly last 10–15 years, and 2029 federal standards change the equipment entering that installed base.
Water heaters sit at the intersection of plumbing, energy, comfort, electrical capacity, venting, indoor air, and household behavior. That makes a single “average replacement price” almost useless without the fuel, tank size, recovery demand, installation conditions, local code, and utility rate attached.
This guide organizes 84 numbered water heater statistics from more than 15 source pages. Federal data and first-party program guidance lead the list. Industry shipment reports and market forecasts are labeled as such. Costs are planning ranges, not quotes.
- DOE estimates that water heating accounts for about 18% of home energy use (DOE Energy Saver).
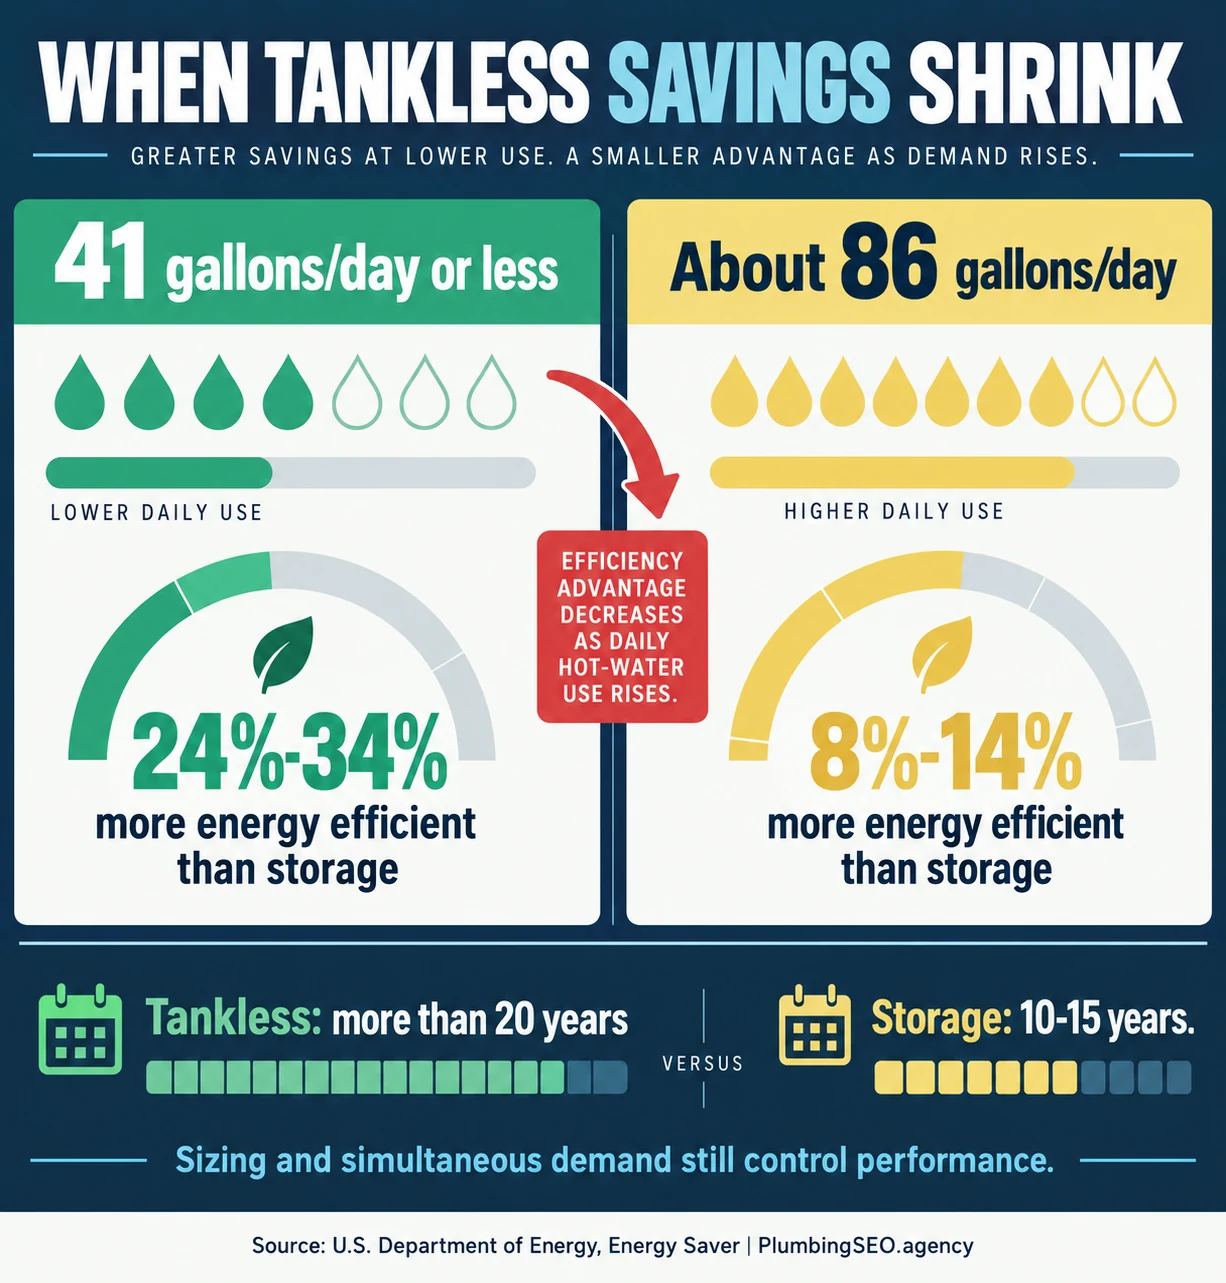
- Tankless equipment can be 24%–34% more efficient at 41 gallons or less of daily hot-water use, but only 8%–14% at about 86 gallons (DOE).
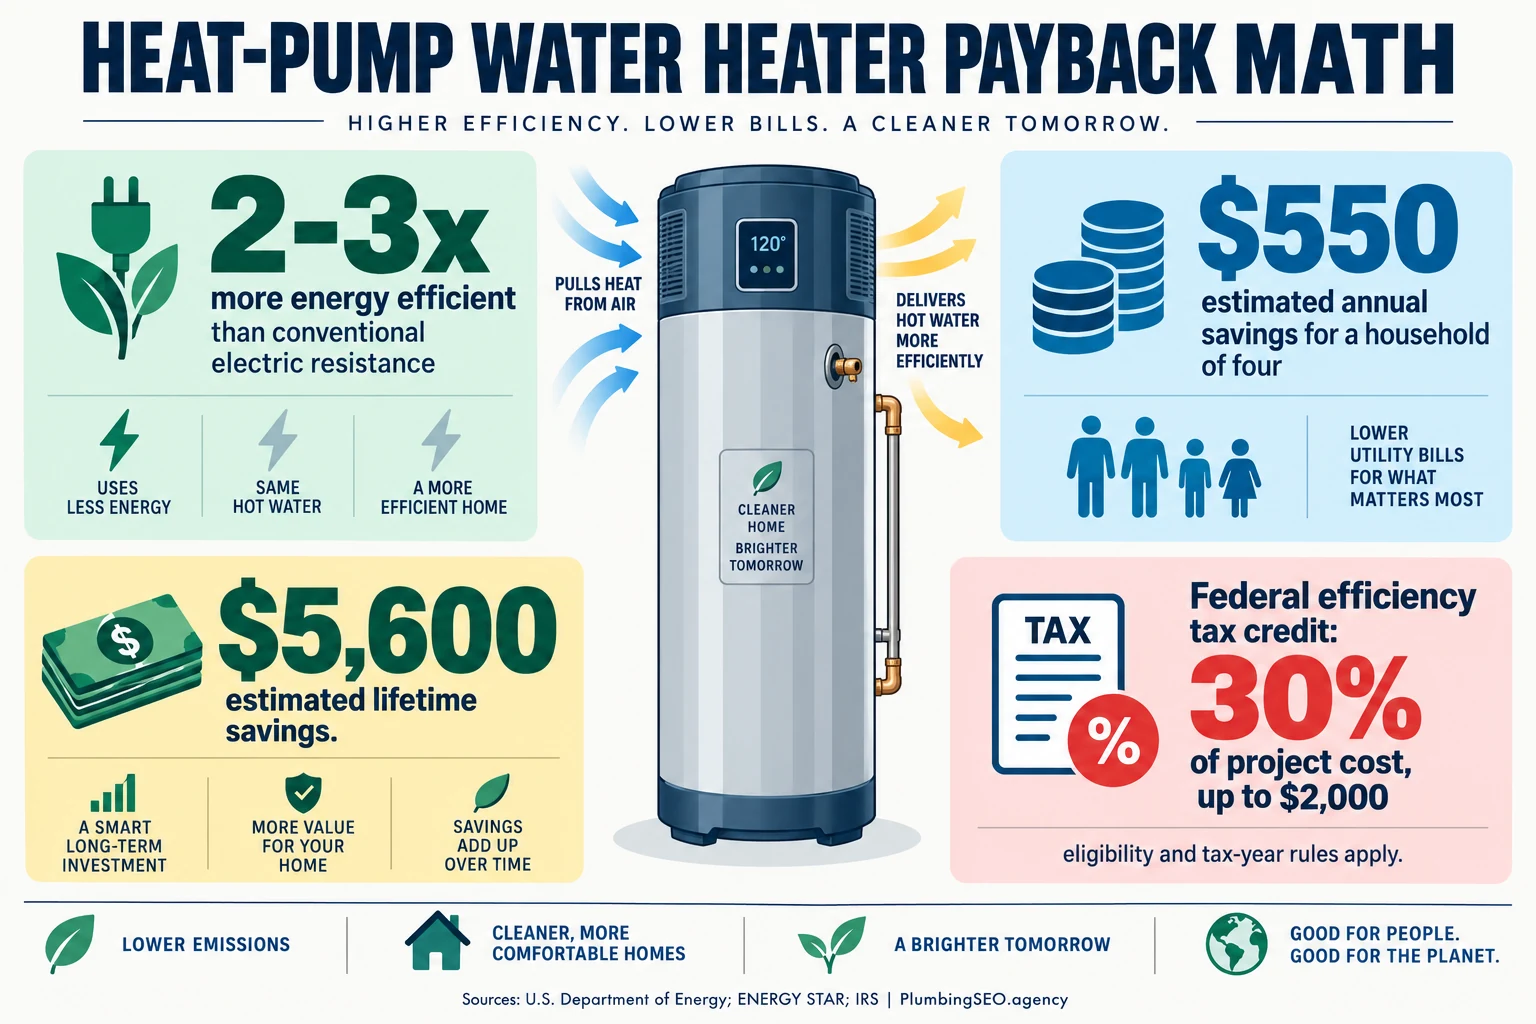
- ENERGY STAR estimates a qualifying heat-pump water heater can save a household of four about $550 per year and $5,600 over its lifetime (ENERGY STAR).
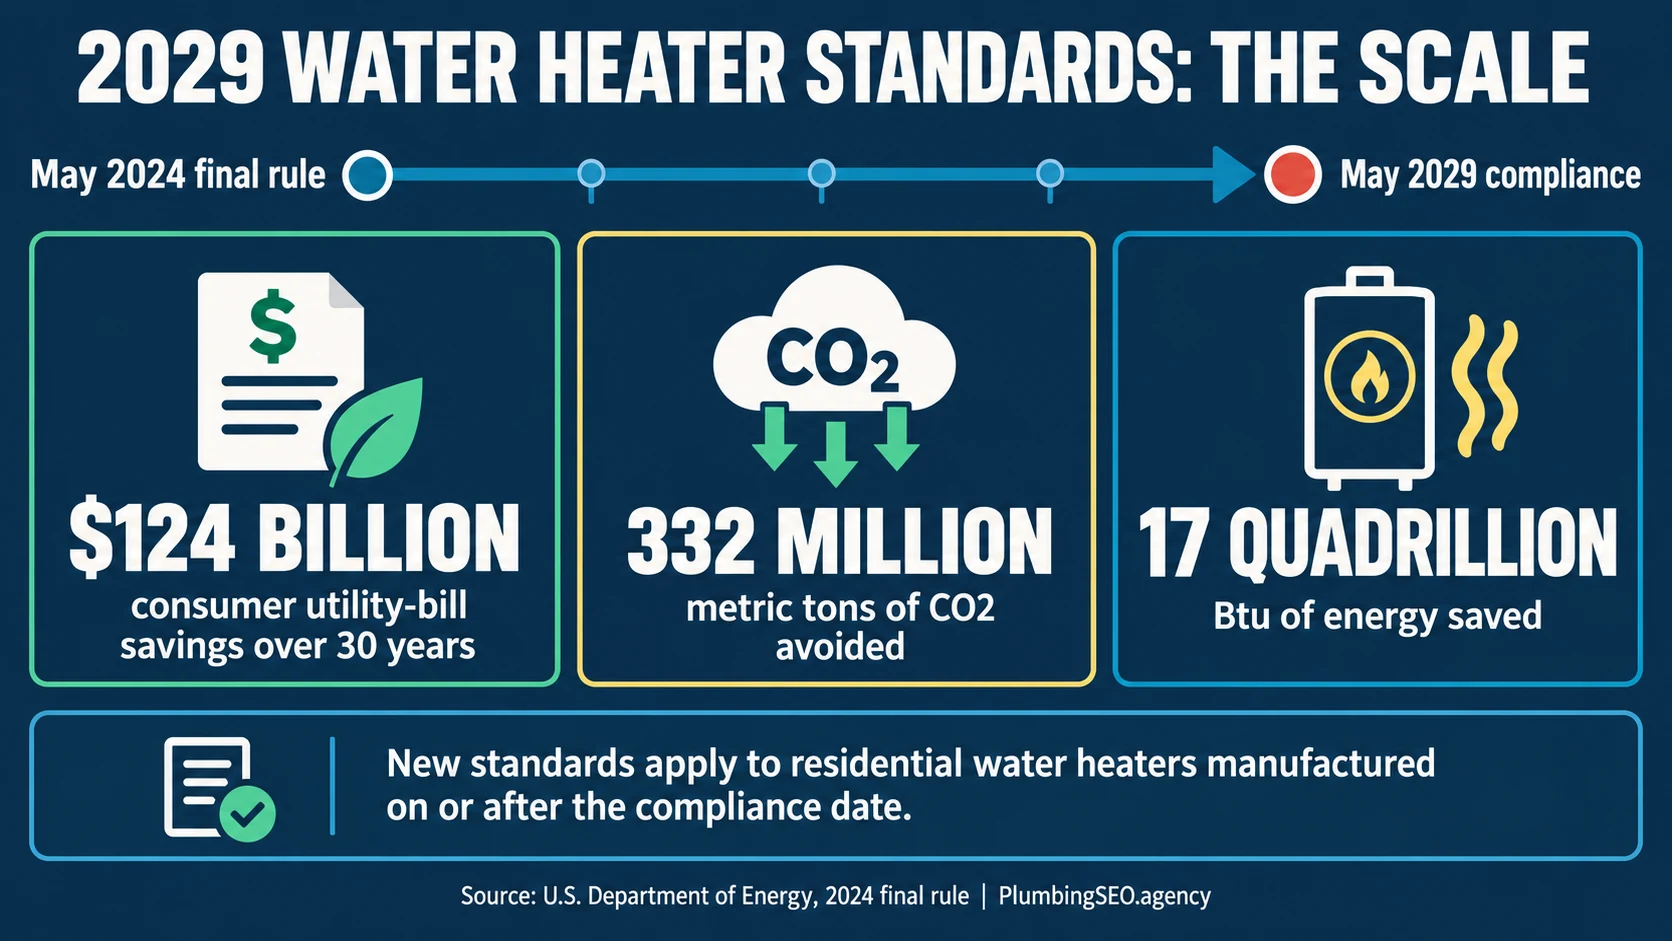
- DOE projects the 2024 final efficiency standards will save consumers $124 billion over 30 years (DOE).
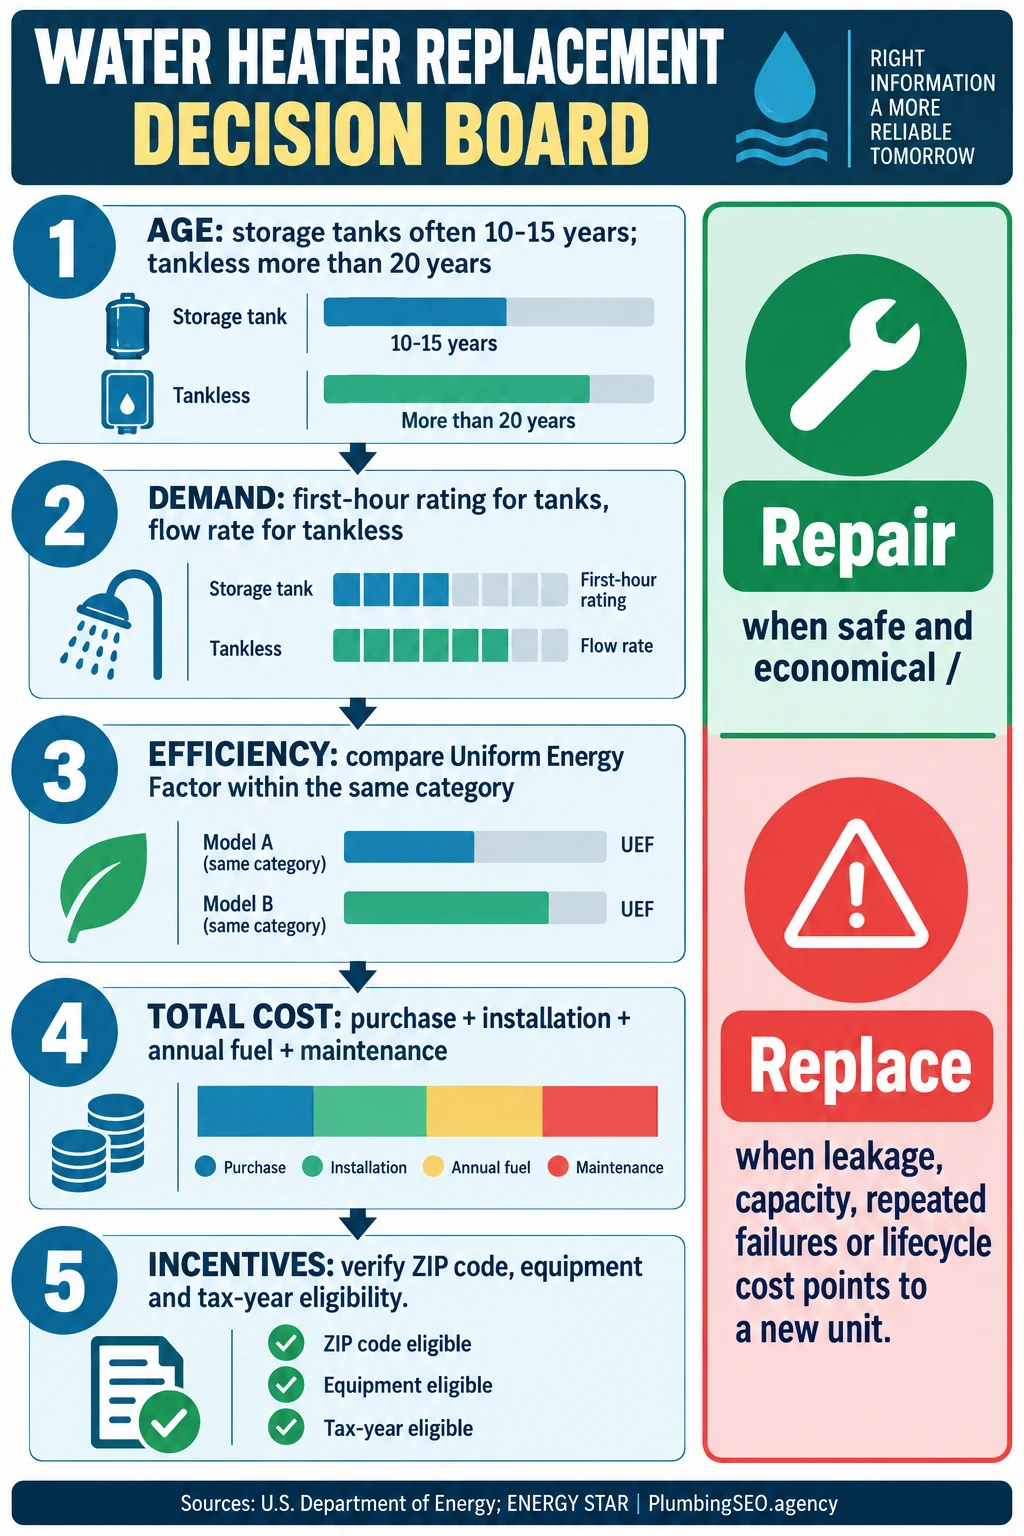
- Equipment age is a triage signal, not a diagnosis. DOE uses a general 10–15-year life for storage models and more than 20 years for many tankless units.
- A plumber should compare first-hour rating, flow rate, fuel, installation work, annual operating cost, maintenance, incentives, and customer usage before recommending equipment.
1. Household water-heater demand and fuel statistics
Water-heater demand starts with the size of the housing stock and the fuel already serving it. Census counts describe properties; EIA's Residential Energy Consumption Survey estimates household fuel use. Neither tells a contractor that a specific unit needs replacement.
| # | Household or fuel benchmark | Value | Source | Scope |
|---|---|---|---|---|
| 1 | Average home energy used for water heating | About 18% | DOE Energy Saver | U.S. household guidance |
| 2 | Typical annual household water-heating cost | $400–$600 | DOE Energy Saver | Typical range, not a quote |
| 3 | Total U.S. housing units | 140,498,736 | U.S. Census Bureau | 2020 Census |
| 4 | Occupied U.S. housing units | 126,817,580 | U.S. Census Bureau | 2020 Census |
| 5 | Owner-occupied housing units | 80,035,754 | U.S. Census Bureau | 2020 Census |
| 6 | Renter-occupied housing units | 46,781,826 | U.S. Census Bureau | 2020 Census |
| 7 | Households represented in 2020 RECS | 123.53 million | EIA RECS | 2020 modeled household universe |
| 8 | Leading main water-heating fuels | Natural gas and electricity | EIA RECS Table HC8.4 | 2020 household fuel table |
That installed base creates recurring replacement demand, but ownership shapes the sale. Homeowners may approve the project directly. Renters usually report the symptom while a landlord or property manager approves scope, access, and equipment.
2. Hot-water use and sizing statistics
Tank volume alone does not size a system. Storage units need enough first-hour delivery; demand units need enough flow and temperature rise. DOE's worksheet values are planning inputs, not a substitute for fixture counts and actual simultaneous use.
| # | Use or sizing benchmark | Value | Source | Application |
|---|---|---|---|---|
| 9 | Typical family-of-four hot-water use | 64 gal/day | ENERGY STAR | Household scenario |
| 10 | Average hot water per shower in DOE worksheet | 10 gallons | DOE sizing guide | Peak-hour estimate |
| 11 | Average hot water for shaving | 2 gallons | DOE sizing guide | Peak-hour estimate |
| 12 | Average hot water for food preparation | 4 gallons | DOE sizing guide | Peak-hour estimate |
| 13 | Average hot water for hand dishwashing | 4 gallons | DOE sizing guide | Peak-hour estimate |
| 14 | Average hot water for an automatic dishwasher | 6 gallons | DOE sizing guide | Peak-hour estimate |
| 15 | Average hot water for a clothes washer | 7 gallons | DOE sizing guide | Peak-hour estimate |
3. Storage and tankless water-heater performance
Tankless savings are load-sensitive. Low-use households avoid more standby loss; high-use households narrow the percentage advantage. Installation also changes the economics when gas lines, venting, electrical service, condensate, or recirculation must be added.
| # | Tankless benchmark | Value | Source | Scope |
|---|---|---|---|---|
| 16 | Efficiency advantage at 41 gal/day or less | 24%–34% | DOE tankless guide | Versus conventional storage |
| 17 | Efficiency advantage at about 86 gal/day | 8%–14% | DOE tankless guide | Higher-use household |
| 18 | Potential savings with one demand unit at each outlet | 27%–50% | DOE tankless guide | Distributed configuration |
| 19 | Typical tankless output | 2–5 gal/min | DOE tankless guide | Temperature rise affects output |
| 20 | Expected tankless service life | More than 20 years | DOE tankless guide | Maintenance and water quality matter |
| 21 | Typical storage water-heater life | 10–15 years | DOE storage guide | General equipment range |
| 22 | Estimated annual operating-cost advantage for gas tankless | About $100 | DOE tankless guide | Versus conventional gas storage |
| 23 | Maximum tankless payback period cited by DOE | More than 20 years | DOE tankless guide | Higher purchase cost can extend payback |
For customer education, explain the two sides together: no tank means less standby loss and long equipment life, but a demand unit can still be undersized for two showers and a dishwasher. Plumbers building educational pages can use the service-specific approach in our tankless water heater SEO guide.
4. Heat-pump water-heater efficiency statistics
A heat-pump water heater moves heat instead of creating all of it through resistance. That efficiency comes with site requirements: air volume, temperature, drainage, electrical capacity, noise planning, and enough recovery for the household.
| # | Heat-pump benchmark | Value | Source | Scope |
|---|---|---|---|---|
| 24 | Efficiency versus conventional electric resistance | 2–3 times higher | DOE Energy Saver | Technology comparison |
| 25 | Recommended surrounding air temperature | 40°F–90°F | DOE Energy Saver | Year-round installation environment |
| 26 | Recommended air space around unit | 1,000 cubic feet | DOE Energy Saver | Typical uncooled-space guidance |
| 27 | Estimated annual household savings | About $550 | ENERGY STAR | Household of four scenario |
| 28 | Estimated lifetime household savings | About $5,600 | ENERGY STAR | Versus standard electric model |
| 29 | Household size in ENERGY STAR savings example | 4 people | ENERGY STAR | Scenario definition |
| 30 | Historical federal credit percentage | 30% | IRS | Tax-year eligibility rules apply |
| 31 | Historical annual credit limit for qualifying heat pumps | Up to $2,000 | IRS | Not a point-of-sale rebate |
Do not sell the headline savings without surveying the site. A cold closet, low ceiling, crowded mechanical room, full electrical panel, blocked condensate route, or large soaking-tub load can change the project.
5. Water-heater conservation and operating-cost statistics
Some of the fastest savings come from the system around the heater: temperature, tank insulation, hot-water piping, fixtures, and distribution. These measures also reduce the load a future replacement must serve.
| # | Conservation benchmark | Value | Source | Scope |
|---|---|---|---|---|
| 32 | Suggested household water-heater setting | 120°F | DOE Energy Saver | Scald and health conditions require judgment |
| 33 | Energy-cost reduction per 10°F temperature decrease | 3%–5% | DOE Energy Saver | Temperature setback estimate |
| 34 | Tank insulation trigger | Less than R-24 | DOE tank insulation | Existing electric tank guidance |
| 35 | Standby heat-loss reduction from tank insulation | 25%–45% | DOE tank insulation | Electric tank scenario |
| 36 | Water-heating cost reduction from tank insulation | 7%–16% | DOE tank insulation | Electric tank estimate |
| 37 | Temperature gain from insulating hot-water pipes | 2°F–4°F | DOE pipe insulation | Delivery-temperature improvement |
| 38 | Solar water-heating bill reduction | 50%–80% | DOE solar water heating | Average estimate; climate and backup vary |
| 39 | WaterSense showerhead maximum flow | 2.0 gal/min | EPA WaterSense | Certified product limit |
| 40 | Federal showerhead maximum flow | 2.5 gal/min | EPA WaterSense | Current federal standard cited by EPA |
| 41 | Annual family water savings from WaterSense showerheads | 2,700 gallons | EPA WaterSense | Average-family estimate |
| 42 | Annual electricity savings tied to efficient showerheads | More than 330 kWh | EPA WaterSense | Reduced water-heating demand |
Conservation can increase usable capacity without changing the tank. It can also improve a replacement recommendation: measure the customer's peak load after correcting excessive fixture flow, not before.
6. Water-heater installed-cost benchmarks
National cost pages are useful for rough planning, not local proposals. HomeAdvisor's published ranges include projects with different fuels, capacities, labor conditions, and permit requirements. A code upgrade, vent redesign, gas-line change, electrical circuit, drain pan, expansion tank, or condensate route can move the real number.
| # | Installed-cost benchmark | Value | Source | Scope warning |
|---|---|---|---|---|
| 43 | Average reported water-heater installation cost | About $1,293 | HomeAdvisor | National consumer cost guide |
| 44 | Typical reported installation range | $874–$1,769 | HomeAdvisor | Not technology-specific |
| 45 | Tank-type installed-cost planning range | $600–$2,500 | HomeAdvisor | Fuel and capacity vary |
| 46 | Tankless installed-cost planning range | $1,000–$3,500 | HomeAdvisor | Infrastructure changes can add cost |
| 47 | Heat-pump or hybrid installed-cost planning range | $1,200–$3,500 | HomeAdvisor | Electrical and site work vary |
| 48 | Solar water-heater installed-cost planning range | $1,700–$5,500 | HomeAdvisor | Collector, climate, roof and backup vary |
| 49 | DOE tankless annual operating-cost advantage | About $100 | DOE Energy Saver | Gas tankless versus gas storage |
7. Water-heater shipments and market outlook
Shipment reports measure equipment moving through the channel, not completed residential replacements. Vendor market forecasts use different geographies and assumptions, so they are direction indicators rather than a single accepted market size.
| # | Market benchmark | Value | Source | Definition |
|---|---|---|---|---|
| 50 | U.S. residential gas storage shipments | 4,078,260 units | AHRI shipment data | Calendar 2023 |
| 51 | U.S. residential electric storage shipments | 4,228,717 units | AHRI shipment data | Calendar 2023 |
| 52 | Combined gas and electric storage shipments | 8.31 million units | AHRI shipment data | Derived from 2023 category totals |
| 53 | Global water-heater market value | $32.56 billion | Fortune Business Insights | 2023 vendor estimate |
| 54 | Global market estimate | $33.94 billion | Fortune Business Insights | 2024 vendor estimate |
| 55 | Global market forecast | $51.97 billion | Fortune Business Insights | 2032 forecast |
| 56 | Forecast global compound annual growth | 5.5% | Fortune Business Insights | 2024–2032 forecast period |
For plumbers, the useful point is not the forecast decimal. It is that water heaters remain a large recurring equipment category, with both gas and electric storage shipments measured in the millions.
8. Federal residential water-heater standard statistics
DOE finalized amended residential water-heater conservation standards in May 2024. The rule affects equipment manufactured for sale after the compliance date; it does not require every working installed heater to be replaced in 2029.
| # | Standards benchmark | Value | Source | Scope |
|---|---|---|---|---|
| 57 | Final-rule publication year | 2024 | DOE final-rule release | Residential water heaters |
| 58 | Final-rule effective date | May 6, 2024 | Federal Register | Rule effective date |
| 59 | Standards compliance date | May 6, 2029 | Federal Register | Manufactured equipment |
| 60 | Projected consumer utility-bill savings | $124 billion | DOE | 30-year shipments |
| 61 | Projected full-fuel-cycle energy savings | 17 quadrillion Btu | DOE | 30-year shipments |
| 62 | Projected carbon-dioxide reduction | 332 million metric tons | DOE | 30-year shipments |
| 63 | Large electric storage threshold highlighted by DOE | More than 35 gallons | DOE | Heat-pump technology pathway |
| 64 | Estimated lifetime savings for compliant large electric model | $1,868 | DOE | Consumer estimate |
| 65 | Estimated lifetime savings for compliant gas instantaneous model | $112 | DOE | Consumer estimate |
The business implication is training, not panic. Shops need technicians who can explain UEF, heat-pump site requirements, condensing drains, venting, electrical coordination, and why a 2029 manufacturing rule is not a deadline to remove functioning equipment.
9. Water-heater rebate and tax-incentive statistics
Incentives are unusually local and date-sensitive. Federal rebate funds are administered through states and territories; utility offers can have separate approved-product lists. Tax credits depend on the tax year and taxpayer. Verify before putting a dollar amount in a proposal.
| # | Incentive benchmark | Value | Source | Eligibility note |
|---|---|---|---|---|
| 66 | Home Electrification and Appliance Rebate maximum for HPWH | Up to $1,750 | DOE Home Energy Rebates | State launch and household eligibility vary |
| 67 | Maximum total household electrification rebates | $14,000 | DOE Home Energy Rebates | Eligible combined measures |
| 68 | Full rebate-cost coverage income threshold | Below 80% AMI | DOE Home Energy Rebates | Subject to statutory and state rules |
| 69 | Partial rebate-cost coverage income band | 80%–150% AMI | DOE Home Energy Rebates | Subject to program rules |
| 70 | Maximum cost coverage below 80% AMI | 100% | DOE Home Energy Rebates | Capped by measure maximum |
| 71 | Maximum cost coverage at 80%–150% AMI | 50% | DOE Home Energy Rebates | Capped by measure maximum |
| 72 | Federal energy-improvement credit rate | 30% | IRS | Confirm current tax-year availability |
| 73 | Heat-pump annual credit ceiling | $2,000 | IRS | Qualifying property and tax rules apply |
Keep a dated incentive sheet by ZIP code, and separate “potentially eligible” from “guaranteed.” A contractor can document model numbers and installation dates, but should not give tax advice.
10. Water-heater lifespan, failure, and damage statistics
An older Insurance Institute for Business & Home Safety claim study remains useful because it separates how storage tanks fail from what replacement guides say about age. Treat the dollar figures as historical insurance data, not a 2026 repair-cost estimate.
| # | Failure benchmark | Value | Source | Scope |
|---|---|---|---|---|
| 74 | Storage units among water-heater failures studied | 95% | IBHS failure study | Historical closed-claim sample |
| 75 | Failures caused by slow leak or sudden burst | 69% | IBHS failure study | Historical claim analysis |
| 76 | Failures occurring before age 12 | 75% | IBHS failure study | Study distribution |
| 77 | Average age at failure | 10.7 years | IBHS failure study | Historical claim sample |
| 78 | Average insurance claim after deductible | $4,444 | IBHS failure study | Historical dollars |
| 79 | Average storage water-heater life | 10–15 years | DOE storage guide | General life range |
| 80 | Tankless expected life | More than 20 years | DOE tankless guide | Replaceable parts can extend service |
| 81 | Tankless-to-storage life midpoint comparison | At least 1.6x | DOE Energy Saver | Derived from >20 years versus 12.5-year midpoint |
| 82 | Typical tankless flow ceiling in DOE range | 5 gal/min | DOE tankless guide | Unit output varies |
| 83 | Typical tankless flow floor in DOE range | 2 gal/min | DOE tankless guide | Unit output varies |
| 84 | Storage-life range width | 5 years | DOE storage guide | Derived from 10–15-year range |
Age can justify an inspection or a replacement option; it does not prove imminent failure. Visible tank leakage, combustion or venting hazards, repeated repairs, inadequate delivery, unavailable parts, and lifecycle cost carry more weight than a birthday alone.
11. What plumbing companies should do with the data
AHRI recorded 8.31 million combined U.S. residential gas and electric storage shipments in 2023. At that scale, the useful output is a better survey, estimate, installation, and follow-up process—not a pitch built from the biggest percentage on the page.
Record the load
Count occupants and fixtures, document peak simultaneous use, incoming-water temperature, current capacity, and first-hour or flow requirements.
Survey the site
Photograph fuel, venting, gas line, breaker space, drain, pan, expansion control, clearance, air volume, condensate path, and access.
Quote complete scope
Separate equipment, labor, disposal, permit, code correction, electrical or gas work, venting, commissioning, and warranty.
Compare lifecycle cost
Show purchase and installation beside annual operating cost, maintenance, expected life, utility rates, and verified incentives.
Prepare for 2029
Train on heat-pump site selection and condensing systems before the manufacturing standards reshape common replacement options.
Track the call
Separate repair, leak, no-hot-water, tank replacement, tankless, heat pump, commercial, maintenance, and emergency demand.
Water-heater searches often carry immediate purchase intent. Build separate educational paths for repair, tank replacement, tankless, heat pump, and commercial work rather than sending every searcher to one generic page. Our water heater SEO guide covers that service-line strategy, while plumbing Google Ads keyword segments can separate replacement intent from DIY and product-only searches.
Connect those pages to call tracking and booked revenue. The call tracking guide for plumbers explains the attribution layer, and a free plumbing SEO audit can find where water-heater demand is leaking between rankings, service pages, and the phone.
12. Summary of all 84 water-heater benchmarks
| Rows | Category | Count | Main sources | Best use |
|---|---|---|---|---|
| 1–8 | Household scale and fuel | 8 | DOE, Census, EIA | Installed-base context |
| 9–15 | Usage and sizing | 7 | DOE, ENERGY STAR | Load conversations |
| 16–23 | Storage and tankless | 8 | DOE Energy Saver | Technology comparison |
| 24–31 | Heat-pump equipment | 8 | DOE, ENERGY STAR, IRS | Efficiency and site planning |
| 32–42 | Conservation | 11 | DOE, EPA WaterSense | Load and cost reduction |
| 43–49 | Installed cost | 7 | HomeAdvisor, DOE | Planning ranges |
| 50–56 | Shipments and market | 7 | AHRI, Fortune Business Insights | Industry scale |
| 57–65 | Federal standards | 9 | DOE, Federal Register | 2029 preparation |
| 66–73 | Incentives | 8 | DOE, IRS | Eligibility screening |
| 74–84 | Failure and life | 11 | IBHS, DOE | Repair-replace decisions |
Methodology and source notes
This article was published October 6, 2026. The count includes the 84 numbered rows only. Repeated headline cards, charts, FAQ answers, and prose do not inflate the total. We prioritized federal agencies and first-party program pages, then used named industry shipment reporting, a historical insurance claim study, a consumer cost guide, and an explicitly labeled third-party market forecast.
A source year stays attached to older data. The 2020 Census and 2020 RECS describe an installed-base context, not a current equipment census. AHRI shipments are units shipped, not installations. Market-forecast values are vendor estimates. HomeAdvisor prices are national planning ranges. IBHS claim dollars are historical and are not adjusted here. Derived figures are identified.
Efficiency percentages compare specified technologies and loads; they are not guaranteed household savings. Incentives require current verification by ZIP code, product, project, income, program status, and tax year. Contractors should follow the adopted local code, manufacturer instructions, permitting requirements, and licensed-trade rules.
- DOE Energy Saver: Water Heating
- U.S. Census Bureau 2020 Housing Counts
- EIA 2020 Residential Energy Consumption Survey
- DOE: Sizing a New Water Heater
- DOE: Tankless or Demand-Type Water Heaters
- DOE: Storage Water Heaters
- DOE: Heat-Pump Water Heaters
- ENERGY STAR: Heat-Pump Water Heaters
- IRS: Energy Efficient Home Improvement Credit
- DOE: Lower Water-Heating Temperature
- DOE: Insulate a Water-Heater Tank
- DOE: Insulate Hot-Water Pipes
- DOE: Solar Water-Heating Savings
- EPA WaterSense: Showerheads
- HomeAdvisor: Water-Heater Installation Cost
- AHRI Monthly Shipment Data
- Fortune Business Insights Water-Heater Market Forecast
- DOE 2024 Residential Water-Heater Standards
- Federal Register Final Rule
- DOE Home Energy Rebates
- IBHS Water-Heater Failure Risks
Water heater statistics FAQ
DOE estimates that water heating accounts for about 18% of average home energy use and typically costs a household $400–$600 per year. Fuel prices, climate, equipment, household size, temperature, and hot-water habits change the result.
DOE gives a general 10–15-year range for storage water heaters and more than 20 years for many tankless units. Water quality, maintenance, installation, load, parts, and operating conditions can shorten or extend service.
DOE estimates 24%–34% higher efficiency than conventional storage at 41 gallons or less of daily hot-water use. At about 86 gallons per day, the advantage falls to 8%–14%.
ENERGY STAR estimates about $550 per year and $5,600 over the unit's life for a household of four compared with a standard electric model. Actual savings depend on rates, climate, use, mode, and installation.
No. The federal rule sets efficiency requirements for covered residential water heaters manufactured on or after the compliance date. It is not a blanket deadline to remove functioning installed equipment.
Age is only one input. Consider tank leakage, safety, repair history, part availability, capacity, efficiency, installation condition, warranty, expected remaining life, and the complete installed cost of the replacement options.
Want more profitable water-heater calls?
Get a practical review of your repair and replacement pages, local visibility, internal links, proof, and call path.
Run My Free SEO Leak Check