
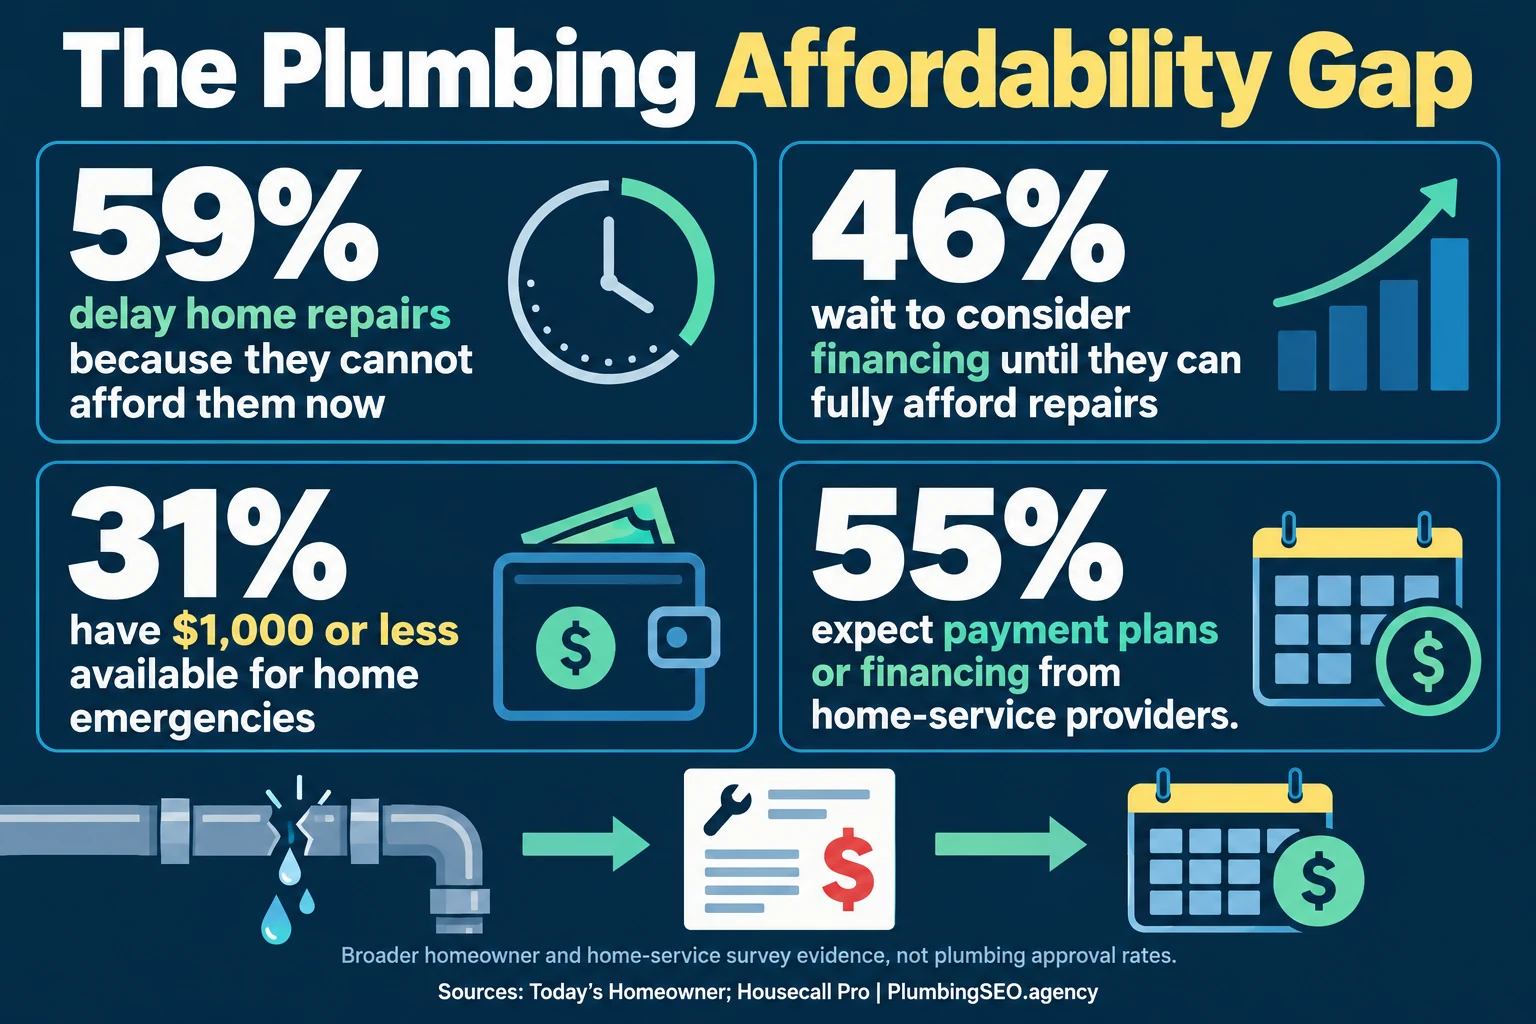
- Affordability blocks real repair demand: 59% of homeowners in one repair survey said they were delaying work because they could not afford it yet.
- Financing is now an expectation for many: 55% of surveyed homeowner decision-makers said they expect payment plans or financing options from a home-service professional.
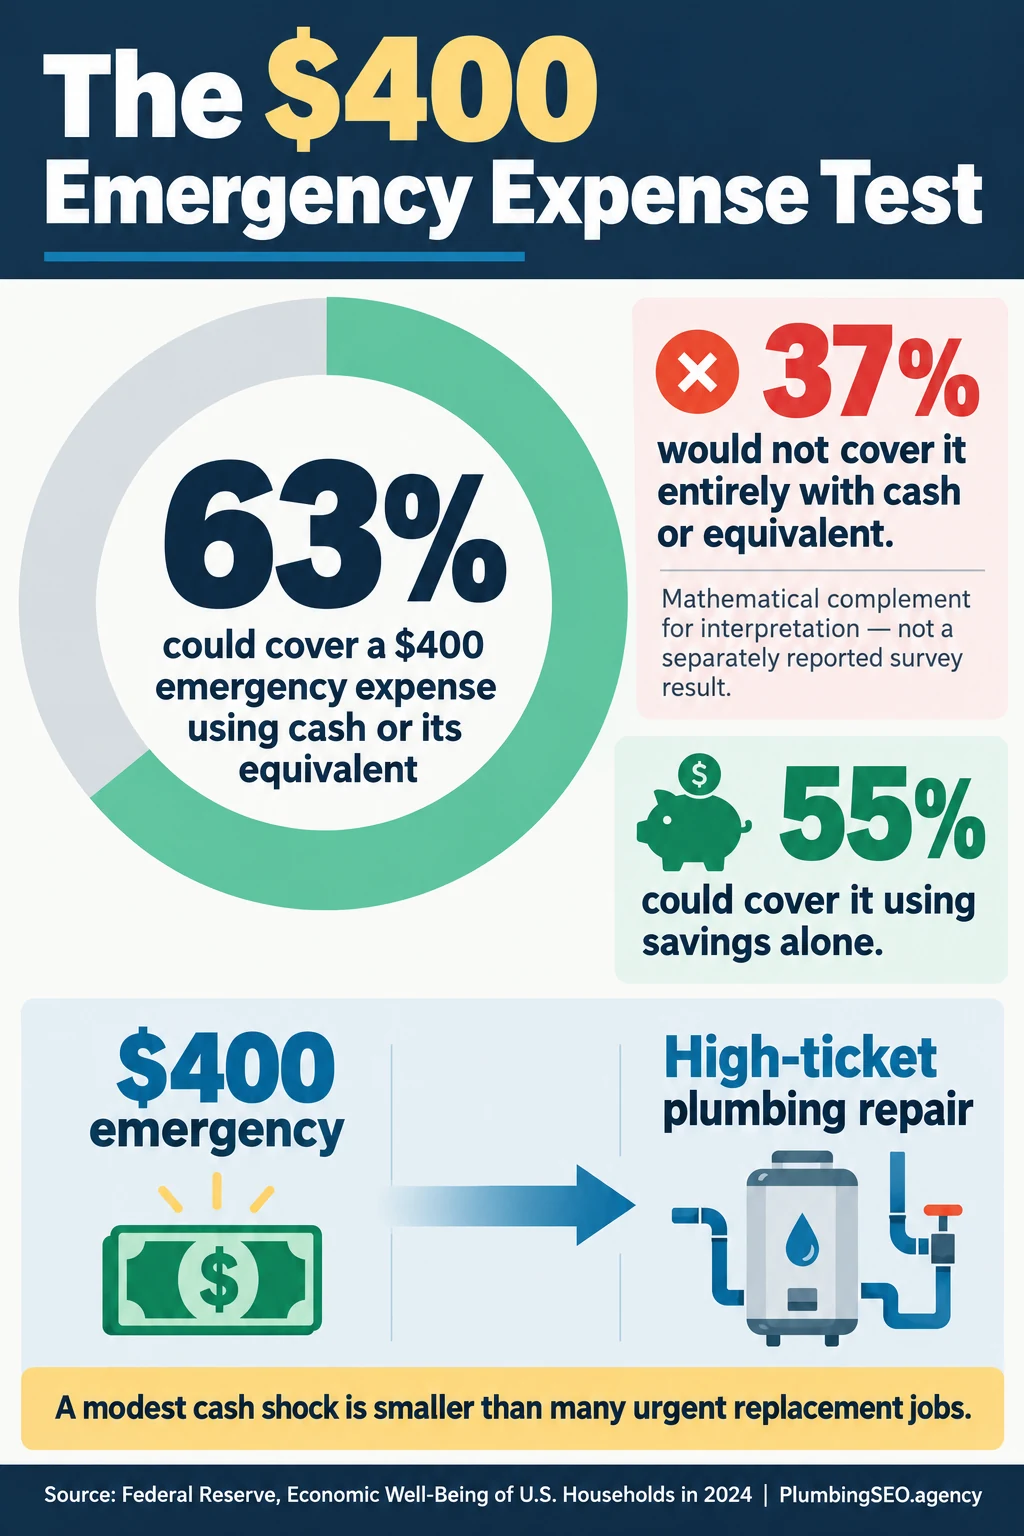
- The cash cushion is limited: the Federal Reserve found 63% of adults could cover a $400 emergency expense using cash or its equivalent, leaving a material gap before many high-ticket plumbing jobs are considered.
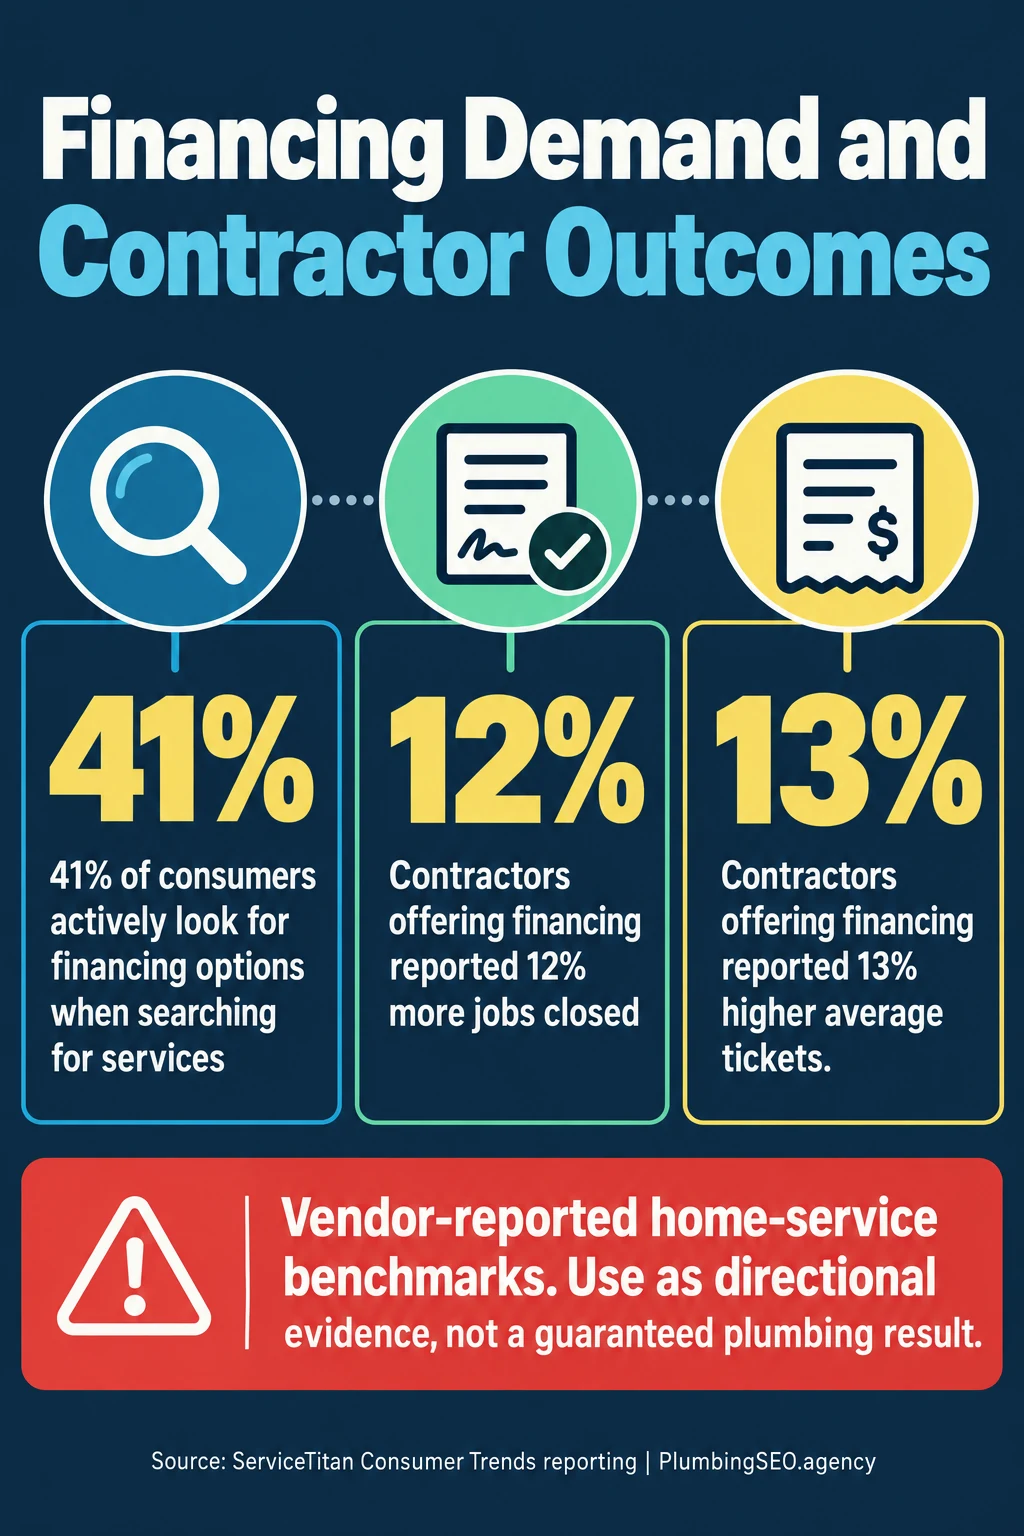
- Vendor outcomes are directional, not promises: ServiceTitan has reported 12% more jobs closed and 13% higher average tickets among contractors offering financing; those figures do not guarantee an individual plumbing company's results.
Plumbing financing sits at the intersection of urgency, trust, price, and household cash flow. A homeowner with sewage backing up into the house may need a decision tonight, while a family comparing repipe estimates may take weeks. In either case, a large upfront number can stop a technically necessary job before the customer evaluates the repair itself.
This guide collects 80 numbered plumbing financing statistics from homeowner surveys, federal financial-health research, credit-market data, home-service platforms, and repair-cost publishers. Public plumbing-only financing data is limited, so every table identifies scope. National credit data and home-services vendor benchmarks are context—not a universal approval, close-rate, or ticket-size prediction for your shop.
How to read plumbing financing data without overselling it
There is no credible universal “plumbing financing approval rate.” Approval depends on the lender, product, applicant pool, credit criteria, project amount, jurisdiction, promotional terms, and how the contractor presents the option. A $900 water-heater repair and a $14,000 sewer replacement do not belong in the same bucket.
The best use of external statistics is diagnostic. They can show why clear financing pages for plumbers deserve attention. Your CRM, lender reports, estimates, booked jobs, completed revenue, refunds, and complaints decide whether the program works locally.
1. Homeowner demand and affordability statistics
Housecall Pro's 2025 customer-service research surveyed 1,040 U.S. homeowner decision-makers. Today's Homeowner examined deferred repair, planned replacements, savings, and expected payment methods. ConsumerAffairs adds context on how frequently plumbing appears in home-repair reports. These are stated expectations and survey responses, not observed loan applications.
| # | Demand or affordability benchmark | Value | Source | Scope |
|---|---|---|---|---|
| 1 | Homeowner decision-makers in the home-service customer survey | 1,040 | Housecall Pro, 2025 | U.S. online survey |
| 2 | Homeowners expecting payment plans or financing options | 55% | Housecall Pro | Home-service expectation |
| 3 | Homeowners frustrated by hidden costs | 77% | Housecall Pro | Pricing communication |
| 4 | Homeowners saying instant estimates influence hiring | 93% | Housecall Pro | Stated influence |
| 5 | Homeowners willing to pay more for a pro with a better service reputation | 70%+ | Housecall Pro | Stated willingness |
| 6 | Homeowners saying at least one area of the home needs maintenance | 82% | Today's Homeowner | Home-repair survey |
| 7 | Homeowners with one or two issues needing repair | 45% | Today's Homeowner | Repair backlog |
| 8 | Homeowners with three or four issues needing repair | 30% | Today's Homeowner | Repair backlog |
| 9 | Homeowners with five or more issues needing repair | 9% | Today's Homeowner | Repair backlog |
| 10 | Homeowners planning to address repairs within six months | 79% | Today's Homeowner | Stated timing |
| 11 | Homeowners delaying repairs because they cannot afford them now | 59% | Today's Homeowner | Affordability barrier |
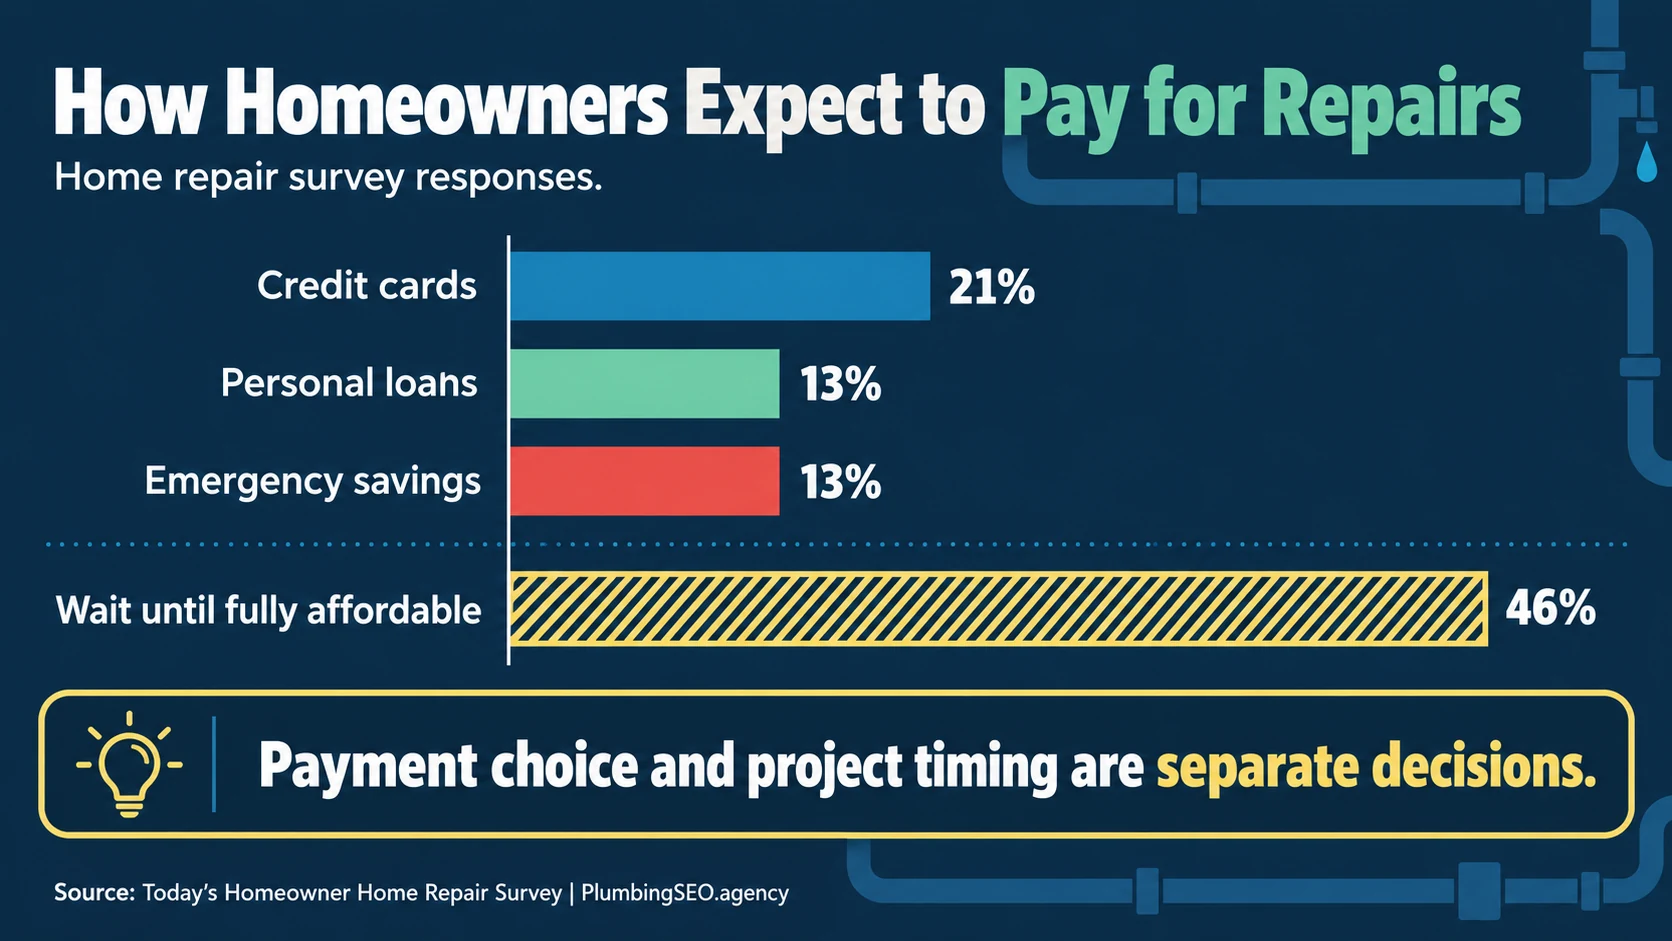
| 12 | Homeowners not considering financing until they can fully afford repairs | 46% | Today's Homeowner | Delay behavior |
| 13 | Homeowners expecting to finance repairs with credit cards | 21% | Today's Homeowner | Expected payment method |
| 14 | Homeowners expecting to use personal loans | 13% | Today's Homeowner | Expected payment method |
| 15 | Homeowners expecting to use emergency savings | 13% | Today's Homeowner | Expected payment method |
| 16 | Homeowners with $1,000 or less available for home emergencies | 31% | Today's Homeowner | Emergency savings |
| 17 | Homeowners with no money set aside for a home-repair emergency | 11% | Today's Homeowner | Emergency savings |
| 18 | Homeowners expecting plumbing replacement within five years | 40% | Today's Homeowner | Replacement planning |
| 19 | Survey respondents reporting a plumbing-system repair | 27.94% | ConsumerAffairs | 773-consumer survey |
| 20 | Consumers surveyed in the ConsumerAffairs repair study | 773 | ConsumerAffairs | Survey base |
Owner takeaway: do not hide financing behind an application button with no explanation. Put plain-language payment-option copy near replacement pricing, estimates, booking, and trust proof. Your plumbing website trust signals still need to carry the decision.
2. Cash reserves, credit, and borrowing capacity
The Federal Reserve's 2024 household well-being report measures financial resilience across U.S. adults. The CFPB's buy now, pay later analysis and Federal Reserve Bank of New York debt data add credit context. None of these datasets is plumbing-specific, but together they explain why a repair quote can collide with existing household obligations.
| # | Household-finance benchmark | Value | Source | Interpretation |
|---|---|---|---|---|
| 21 | Adults doing okay or living comfortably financially | 73% | Federal Reserve, 2024 SHED | Self-reported well-being |
| 22 | Adults able to cover a $400 emergency expense with cash or equivalent | 63% | Federal Reserve, 2024 SHED | Cash, savings, or card paid next statement |
| 23 | Adults able to cover a $400 emergency expense with savings alone | 55% | Federal Reserve, 2024 SHED | Savings-only measure |
| 24 | Adults not able to cover $400 fully with cash or equivalent | 37% | Derived from Federal Reserve | 100% minus reported 63%; not a separate survey response |
| 25 | Adults who would borrow or sell something to cover a $400 expense | 30% | Federal Reserve, 2024 SHED | Alternative funding response |
| 26 | Adults unable to pay a $400 expense by any method | 13% | Federal Reserve, 2024 SHED | Financial fragility |
| 27 | Adults who spent less than their income in the prior month | 51% | Federal Reserve, 2024 SHED | Monthly cash flow |
| 28 | Adults with savings for three months of expenses | 55% | Federal Reserve, 2024 SHED | Rainy-day savings |
| 29 | Adults who did not pay all bills in full in the prior month | 17% | Federal Reserve, 2024 SHED | Bill-payment strain |
| 30 | Consumers with a credit record who used buy now, pay later in 2022 | 21.2% | CFPB | BNPL usage, not home improvement only |
| 31 | Average number of BNPL loans originated per borrower in 2022 | 6 | CFPB | Five-firm dataset |
| 32 | Average annual BNPL borrowing per borrower in 2022 | About $1,000 | CFPB | Five-firm dataset |
| 33 | BNPL borrowers with simultaneous loans at some point during the year | 63% | CFPB | 2022 borrower behavior |
| 34 | BNPL borrowers using multiple firms during the year | 33% | CFPB | 2022 borrower behavior |
| 35 | Total U.S. household debt at the end of 2025 Q2 | $18.39T | New York Fed | Consumer Credit Panel |
| 36 | Mortgage balances at the end of 2025 Q2 | $12.94T | New York Fed | Nationwide balance |
| 37 | HELOC balances at the end of 2025 Q2 | $411B | New York Fed | Nationwide balance |
| 38 | Credit-card balances at the end of 2025 Q2 | $1.21T | New York Fed | Nationwide balance |
| 39 | Auto-loan balances at the end of 2025 Q2 | $1.66T | New York Fed | Existing household obligation |
| 40 | Student-loan balances at the end of 2025 Q2 | $1.64T | New York Fed | Existing household obligation |
| 41 | Outstanding debt in some stage of delinquency in 2025 Q2 | 4.4% | New York Fed | Aggregate debt measure |
| 42 | Average U.S. FICO score in 2024 | 715 | Experian | Credit-profile context |
| 43 | Average credit-card balance in Q3 2024 | $6,730 | Experian | Per consumer with card balance reporting |
| 44 | Average credit-card utilization in Q3 2024 | 30% | Experian | Credit-use context |
3. Plumbing costs that can trigger a financing conversation
Cost guides are not quotes. Geography, access, materials, permits, damage, restoration, timing, and diagnosis can move the final number dramatically. Their value here is scale: many common emergencies exceed the $400 resilience benchmark, and replacements can move into several thousand dollars.
| # | Repair-cost or demand benchmark | Value | Source | Scope |
|---|---|---|---|---|
| 45 | Homeowners experiencing a summer plumbing issue | 66% | Hippo | Surveyed U.S. homeowners |
| 46 | Completed homeowner responses in the plumbing survey | 2,147 | Hippo | Survey base |
| 47 | Homeowners reporting property damage from summer plumbing issues | 27% | Hippo | Damage incidence |
| 48 | Homeowners reporting a water-bill spike after a summer issue | 29% | Hippo | Bill impact |
| 49 | Homeowners reporting routine disruption | 31% | Hippo | Household impact |
| 50 | Homeowners paying at least $200 for their last plumbing issue | 60% | Hippo | Reported prior cost |
| 51 | Homeowners paying more than $500 for their last plumbing emergency | 37% | Hippo | Reported emergency cost |
| 52 | Most common repair band among homeowners who skipped summer maintenance | $200–$499 | Hippo | Survey cost band |
| 53 | Homeowners spending over $3,000 who also reported property damage | 55% | Hippo | Association, not causation |
| 54 | Homeowners spending $2,000–$2,999 who reported property damage | 47% | Hippo | Association, not causation |
| 55 | Homeowners spending $1,000–$1,999 who reported property damage | 40% | Hippo | Association, not causation |
| 56 | Common emergency plumber hourly range | $100–$500/hr | Angi | Consumer cost guide |
| 57 | Average emergency plumber hourly cost | $170/hr | Angi | Consumer cost guide |
| 58 | Typical regular plumber hourly range before emergency pricing | $40–$200/hr | Angi | Consumer cost guide |
| 59 | Emergency plumber timing and urgency multiplier | 1.5×–3× | Angi | Reported range |
| 60 | Weekday-evening emergency hourly range | $60–$300/hr | Angi | After-hours range |
| 61 | Weekend emergency hourly range | $80–$400/hr | Angi | Weekend range |
| 62 | Holiday emergency hourly range | $120–$600/hr | Angi | Holiday range |
| 63 | Average emergency plumber hourly range | $100–$350/hr | HomeGuide | Separate cost guide |
| 64 | Common non-business-hours service-call fee or surcharge | $150–$250 | HomeGuide | Reported range |
| 65 | Emergency burst or leaking pipe repair range | $500–$5,000 | HomeGuide | Reported range |
| 66 | Outside-hours simple drain or toilet clog range | $300–$800 | HomeGuide | Reported range |
| 67 | Severe-clog hydro-jetting range | $600–$1,600+ | HomeGuide | Reported range |
| 68 | Emergency water-heater repair range | $150–$750+ | HomeGuide | Reported range |
| 69 | Standard tank water-heater replacement range | $800–$3,000+ | HomeGuide | Reported range |
| 70 | Emergency sewer-line repair range | $500–$3,800 | HomeGuide | Reported range |
| 71 | Emergency gas-line repair range for one appliance | $350–$2,000 | HomeGuide | Reported range |
| 72 | Sewer-line replacement estimate for 40 linear feet | $2,000–$10,000 | HomeGuide | Consumer cost guide |
Owner takeaway: use cost ranges to decide where the option belongs, not to promise a price before diagnosis. Water heaters, sewer work, repipes, burst pipes, gas lines, and large excavations deserve transparent estimate paths. Cost context should start a clearer estimate conversation, not replace a local diagnosis.
4. Financing demand and contractor outcome benchmarks
Platform and financing-provider reports are closer to contractor operations, but they also come from companies that benefit when contractors adopt financing. That does not make the findings useless. It means they should be labeled, time-stamped, and tested against your own data.
| # | Contractor or market benchmark | Value | Source | Caution |
|---|---|---|---|---|
| 73 | Consumers reported as actively looking for financing options when searching for services | 41% | ServiceTitan | Home-services vendor reporting |
| 74 | More jobs closed by contractors offering financing | 12% | ServiceTitan | Reported association, not guaranteed lift |
| 75 | Higher average ticket among contractors offering financing | 13% | ServiceTitan | Reported association, not guaranteed lift |
| 76 | Contractor respondents saying most projects above $5,000 are financed | 65% | Joist | Contractor survey reporting |
| 77 | Homeowners reported as interested in contractor-provided financing | 25% | Joist | Home-improvement context |
| 78 | Typical call-booking rate in a study of 3,000+ trade businesses | 42% | ServiceTitan, 2022 | Not a financing-only metric |
| 79 | Plumbing paid-search cost per lead benchmark | $129.02 | LocaliQ, 2025 | Configured campaign conversions |
| 80 | Plumbing paid-search conversion-rate benchmark | 7.63% | LocaliQ, 2025 | Marketing context, not approval rate |
Marketing spend makes this connection important. If a plumbing lead costs real money, the website, call taker, technician, estimate, lender handoff, and follow-up all need one coherent path. Use lead tracking for plumbers to connect the source to the booked and completed outcome.
5. Offer design, disclosures, and consumer clarity
Financing copy is part sales message and part expectation management. It should say who provides the financing, whether an application is required, and that approval, rates, terms, and payments depend on the provider and applicant. Do not advertise one promotional payment forever if the offer changes next month.
1Separate price from payment
Show the approved project price before presenting a monthly-payment illustration. A low monthly number without total cost, term, APR, and conditions can mislead.
2Name the provider
Make clear whether financing is offered by a third party. Link to current provider disclosures and privacy information instead of rewriting legal terms from memory.
3Never promise approval
Use “subject to credit approval” or the lender-approved equivalent. Do not let technicians improvise approval odds based on appearance, neighborhood, age, or assumptions.
4Explain the next step
Tell the customer whether checking options affects credit, what information is requested, who receives it, and how long a decision usually takes.
5Keep promotions current
Date-review every advertised zero-interest, deferred-interest, promotional-APR, minimum-purchase, and term claim with the provider.
6Preserve non-financing choices
Present cash, card, check, staged work where appropriate, and financing without steering a customer into debt as the only respectable choice.
The Consumer Financial Protection Bureau and Federal Trade Commission publish consumer guidance on credit terms and advertising. Your lender, attorney, and compliance team should approve the exact language used in your jurisdiction and channel.
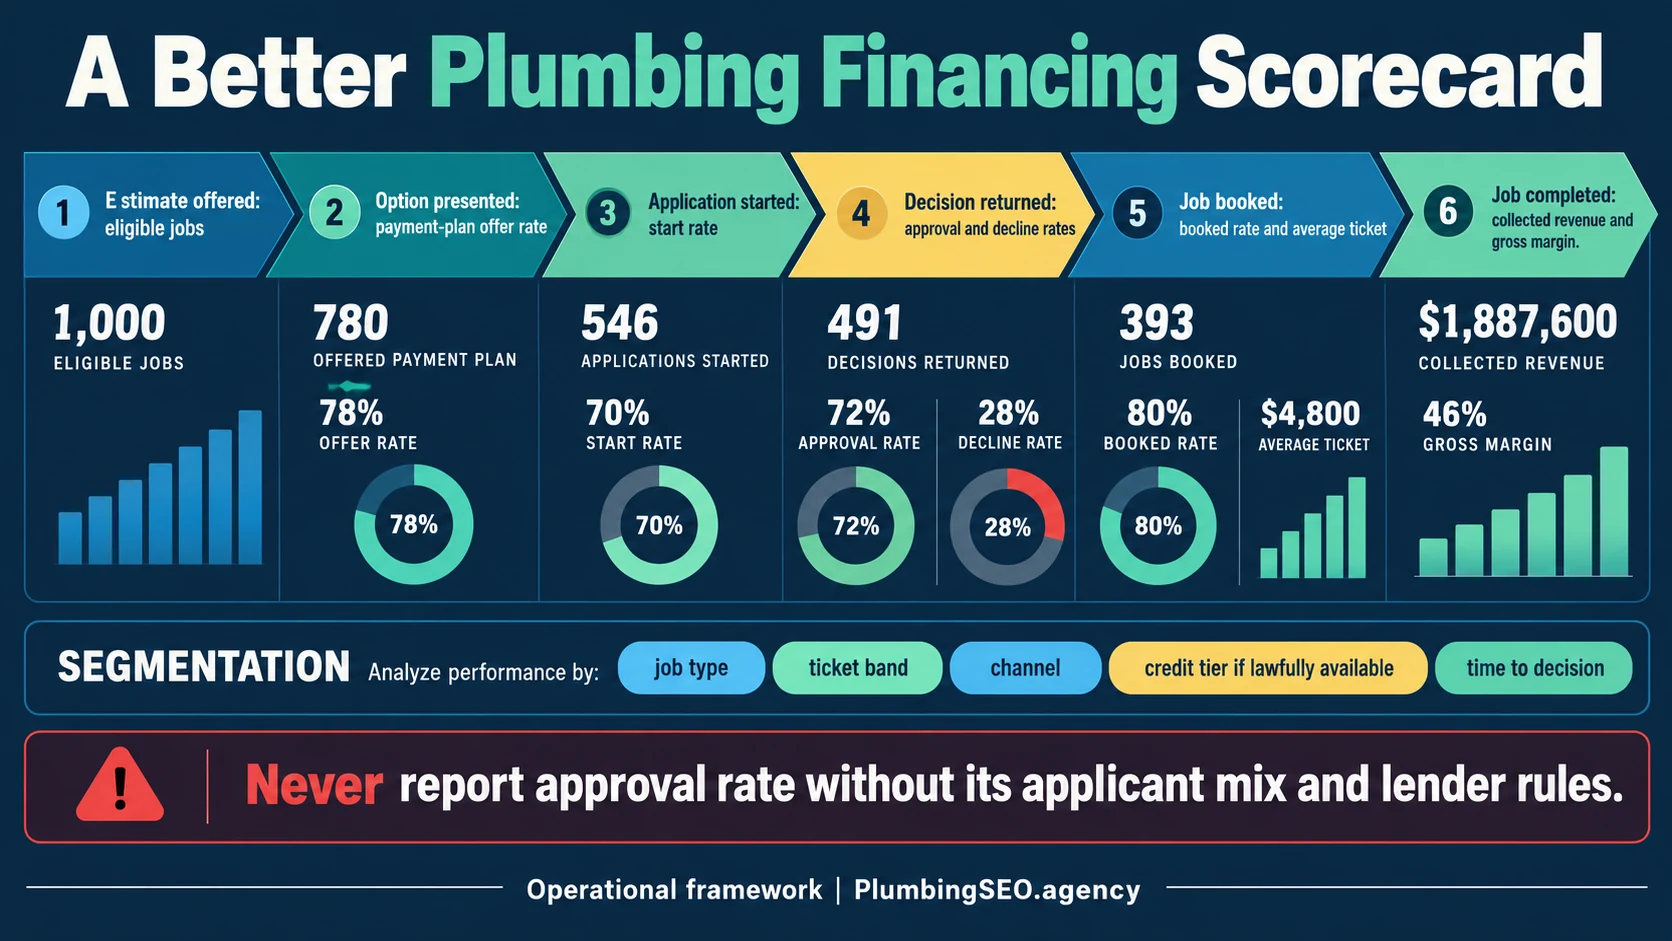
Build a plumbing financing scorecard that leads to action
Approval rate by itself can be dangerously flattering. A shop can increase approval rate by offering financing only to customers it assumes will qualify, while treating others inconsistently. It can also book larger jobs and still lose money after merchant fees, discounts, cancellations, callbacks, and acquisition cost.
Offer coverage
Track eligible estimates, option-presented rate, technician or comfort-advisor variance, service line, ticket band, and whether the customer received the required disclosures.
Application path
Track application starts, completed applications, time to decision, technical failures, abandonment point, and provider. Never store applicant data your business does not need.
Decision mix
Track approvals, declines, pending decisions, approved amount, and applicant-selected term only when lawfully available and necessary. Review fairness and consistency.
Sales outcome
Track booked rate, average approved estimate, average completed ticket, cancellation, downsell, upsell, and jobs delayed after approval.
Economics
Track lender or merchant fee, gross margin, acquisition cost, callback cost, refund, chargeback, collection timing, and cash-flow effect.
Customer outcome
Track questions, disclosure complaints, payment confusion, cancellations, reviews mentioning financing, and whether customers understood the agreement was with a lender.
A practical monthly review
- Segment eligible estimates by water heater, sewer, repipe, emergency, fixture, and other service lines.
- Compare cash and financed estimates on close rate, completed ticket, gross margin, cancellation, and callback—not ticket alone.
- Audit five accepted and five declined or abandoned applications for process problems, without second-guessing the lender's credit decision.
- Review every complaint and any website copy that mentions a specific term, APR, or promotional payment.
- Choose one operational leak to fix and document the owner, deadline, and expected measurement change.
Financing cannot rescue a confusing estimate or a weak reputation. Pair the program with clear response standards from our plumbing customer service statistics guide and measure the whole customer journey.
Methodology and source notes
This article was published October 21, 2026. We prioritized federal agencies, a Federal Reserve Bank credit panel, named homeowner surveys, home-service platform reports, and cost guides with visible scope. The 80 numbered entries retain the source's subject and period. We excluded unsupported universal approval rates and did not turn vendor-reported associations into guaranteed plumbing outcomes.
Some source pages update over time. A plumbing company using a number in advertising should confirm the live source, date, geography, population, financing provider, and legal review. Cost-guide ranges are educational and should not replace a local diagnosis or written estimate.
- Housecall Pro Home Service Customer Service Report (2025) — survey of 1,040 U.S. homeowner decision-makers.
- Today's Homeowner Home Repair Survey — repair backlog, affordability, planned payment methods, emergency savings, and replacement intent.
- ConsumerAffairs Home Repair Statistics — survey reporting plumbing repair frequency across 773 consumers.
- Federal Reserve Economic Well-Being of U.S. Households in 2024 — national household financial-resilience research.
- CFPB Consumer Use of Buy Now, Pay Later — credit-record-linked BNPL research.
- CFPB BNPL Market Reporting — five-lender market data and borrower averages.
- New York Fed Quarterly Report on Household Debt and Credit, 2025 Q2 — nationwide debt balances and delinquency context.
- Experian State of Credit Cards — average FICO score and card-balance context.
- Hippo Summer Plumbing Emergencies Survey — 2,147 completed homeowner responses on issue, damage, and cost patterns.
- Angi Emergency Plumber Cost Guide — hourly ranges and after-hours multipliers.
- HomeGuide Emergency Plumber Cost Guide — service-call, burst-pipe, clog, water-heater, sewer, and gas-line ranges.
- HomeGuide Sewer Line Cost Guide — sewer repair and replacement context.
- ServiceTitan Contractor Financing Reporting — consumer-search and contractor outcome benchmarks; vendor-reported.
- Joist Contractor Financing Guide — contractor and homeowner financing survey context; vendor-reported.
- ServiceTitan Call Booking Analysis — 3,000+ trade businesses; used only as funnel context.
- LocaliQ Home Services Search Advertising Benchmarks (2025) — plumbing paid-search cost and conversion context.
- FTC How to Read a Credit Advertisement — supporting consumer-credit advertising guidance.
- U.S. Bank Home Improvement Financing Options — supporting product-definition context.
- SoFi Plumbing Repair Financing Overview — supporting consumer option context.
Frequently asked questions
Start with the affordability gap, not a vendor lift claim. In the cited surveys, 59% of homeowners delayed repairs because of affordability, 55% expected a home-service professional to offer payment plans or financing, and 63% of adults could cover a $400 emergency expense using cash or its equivalent. Compare those figures with your own eligible estimates, applications, approvals, completed jobs, margins, and complaints.
No. ServiceTitan has reported 12% more jobs closed and 13% higher average tickets among contractors offering financing, but those are vendor-reported associations. Results depend on demand, applicant mix, lender, offer design, technician presentation, pricing, trust, follow-up, fees, cancellations, and local conditions.
High-ticket or urgent work creates the clearest need: water-heater replacement, sewer repair or replacement, repiping, burst pipes, gas lines, excavation, and major damage-related work. Eligibility and product terms still depend on the financing provider and applicant.
Track eligible estimates, offer-presented rate, application starts and completions, decision time, approvals and declines, booked rate, completed ticket, lender fees, gross margin, cancellations, callbacks, refunds, and complaints. Segment by service line, ticket band, lead source, provider, and time period.
Avoid guaranteed approval, unsupported approval odds, permanent promotional terms, or monthly payments that omit the conditions needed to qualify. Use provider-approved wording and make clear that approval, rates, terms, and payments depend on the lender and application.
Use a dedicated financing page and contextual links from water-heater, sewer, repipe, emergency, estimate, and contact pages. Keep the explanation close to price anxiety without replacing service proof, reviews, licensing, warranty information, and an easy call or booking path.
Are high-ticket plumbing leads leaking after the estimate?
We can review the search path, service pages, financing content, trust signals, calls, and tracking that connect local demand to booked plumbing work.
Run My Free SEO Leak Check