
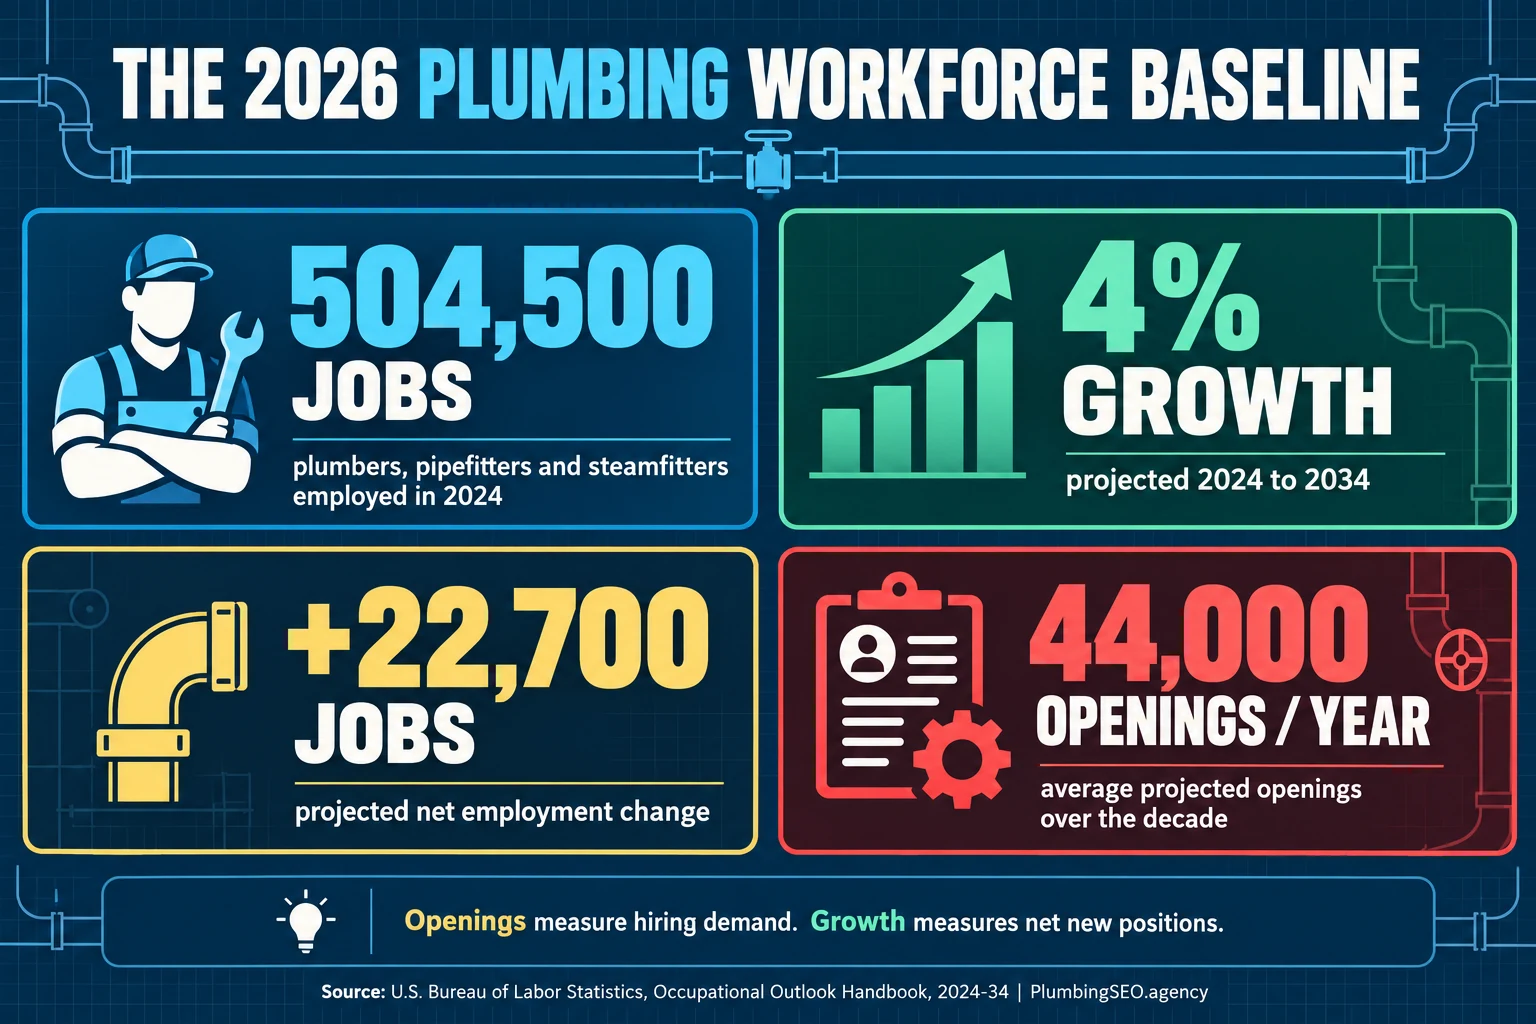
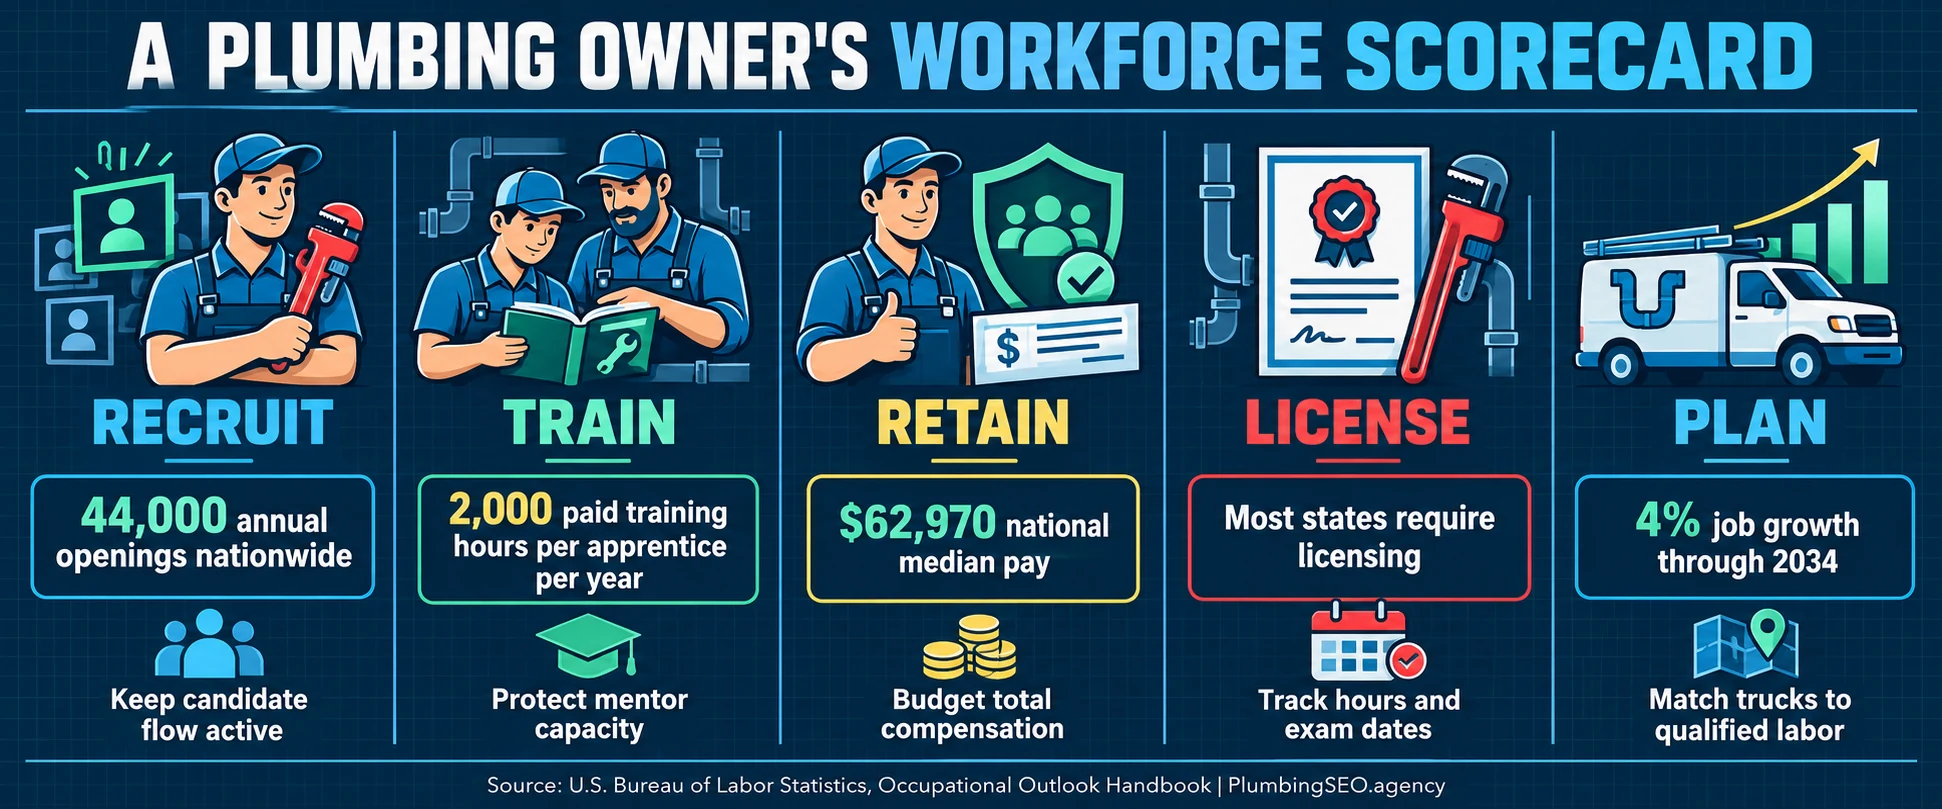
- The labor market is bigger than net growth: BLS projects 44,000 openings per year even though net employment is forecast to grow 4% from 2024 to 2034.
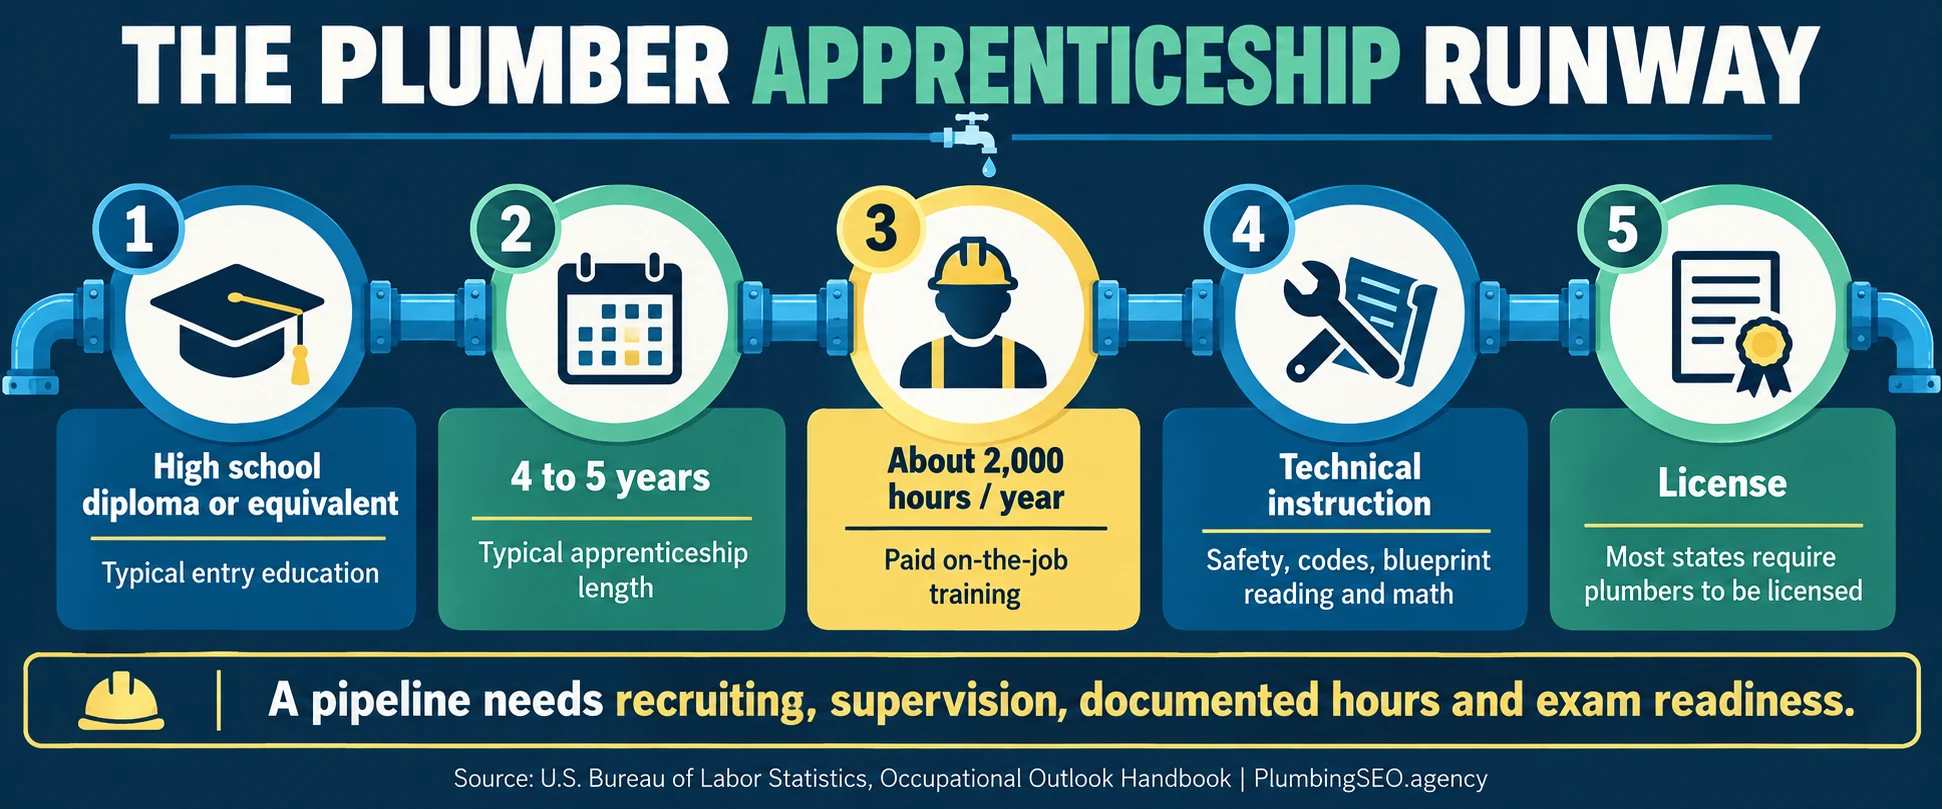
- The pipeline takes years: a plumbing apprenticeship commonly runs four to five years and includes about 2,000 hours of paid job training per year.
- Local shops need a bench, not one job ad: recruiting, documented training, license tracking, mentor capacity, retention, and steady booked work all belong in the same workforce plan.
A plumbing owner can have three trucks ready, a clean dispatch board, and enough demand to fill the week, then get stopped by one hard fact: there is nobody qualified to put in the driver seat. Labor is not a side issue. It controls how many calls you can take, which jobs you can sell, how far crews can drive, and whether the company can grow without burning out the people already carrying it.
This U.S.-focused guide organizes 82 numbered plumbing workforce statistics and benchmarks. It centers employment, openings, replacement demand, skilled-worker shortages, apprenticeships, licensing, union and nonunion routes, demographics, and employer decisions. Pay appears only where it helps explain labor supply and retention. For deeper compensation and owner-income data, use the separate plumber salary and business income statistics reference.
- BLS counted 504,500 jobs for plumbers, pipefitters and steamfitters in 2024 (BLS Occupational Outlook Handbook).
- Employment is projected to rise 4% through 2034, adding 22,700 net jobs (BLS).
- BLS projects about 44,000 openings per year, with many openings tied to workers leaving the occupation or labor force, not only growth.
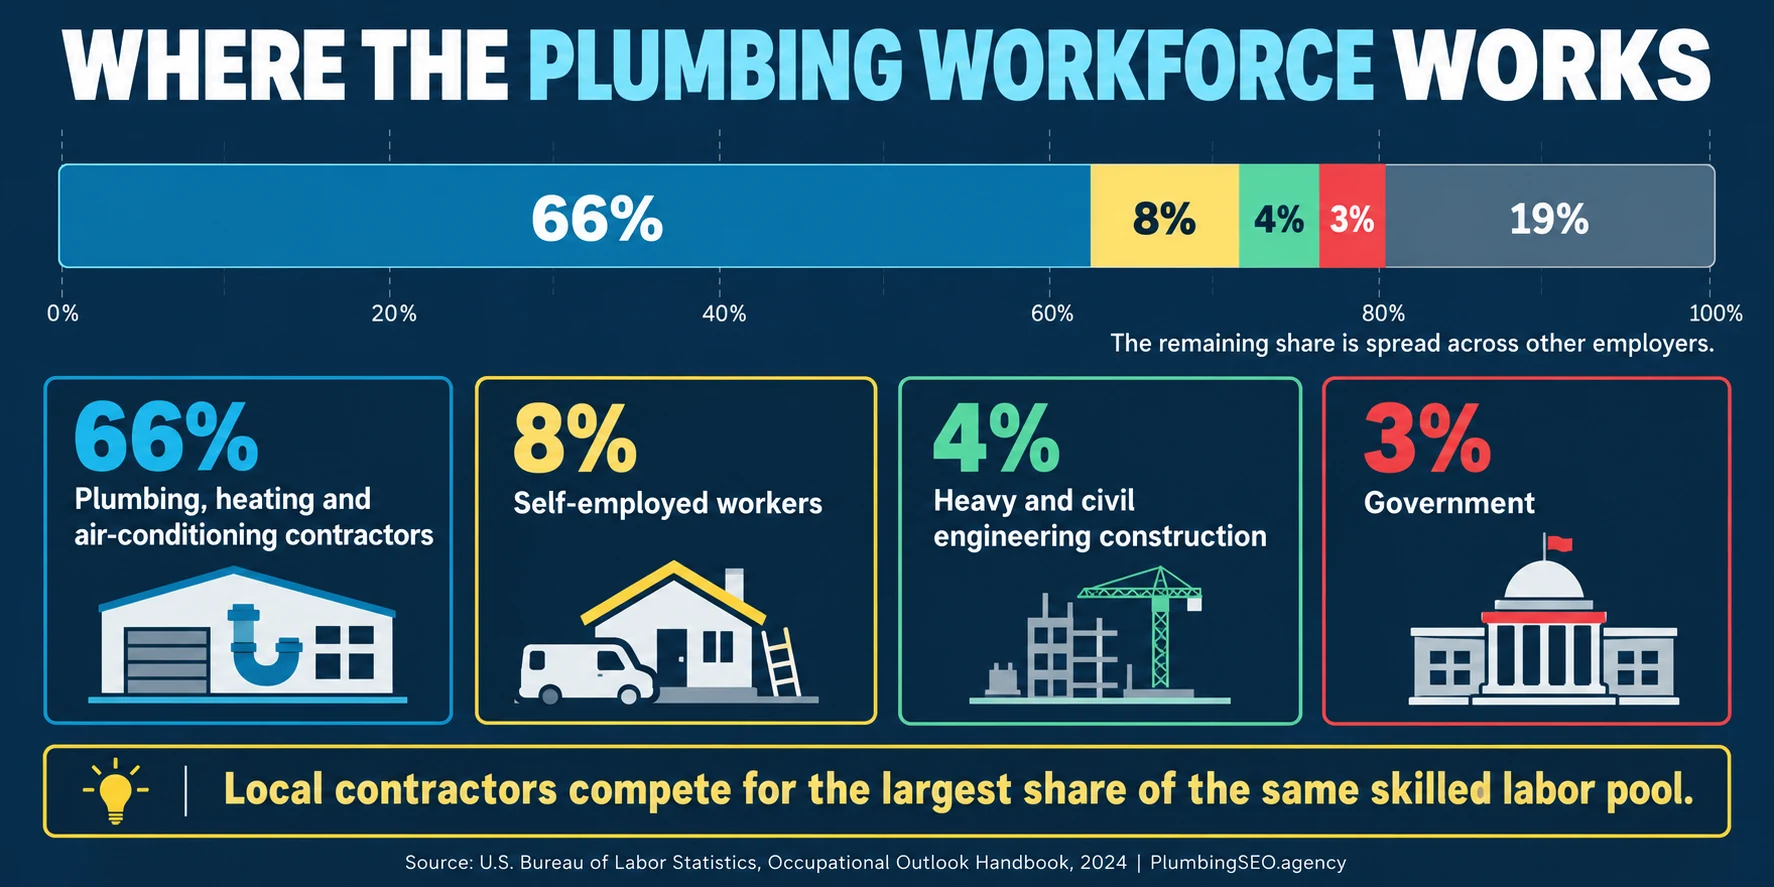
- Plumbing, heating and air-conditioning contractors employ 66% of the occupation, while 8% are self-employed (BLS).
- Typical apprenticeships last four to five years and provide about 2,000 paid on-the-job hours per year.
- The PHCC four-year curriculum is designed around 576 classroom hours and 8,000 hours of on-the-job learning (PHCC Educational Foundation).
- Registered Apprenticeship reported more than 679,000 active apprentices in fiscal 2024 across all occupations (ApprenticeshipUSA).
- Associated Builders and Contractors estimated construction needed 439,000 additional workers in 2025 and 499,000 in 2026 beyond normal hiring (ABC).
- Most states require plumbers to be licensed, but experience hours, exams and scope rules differ by state and sometimes by city.
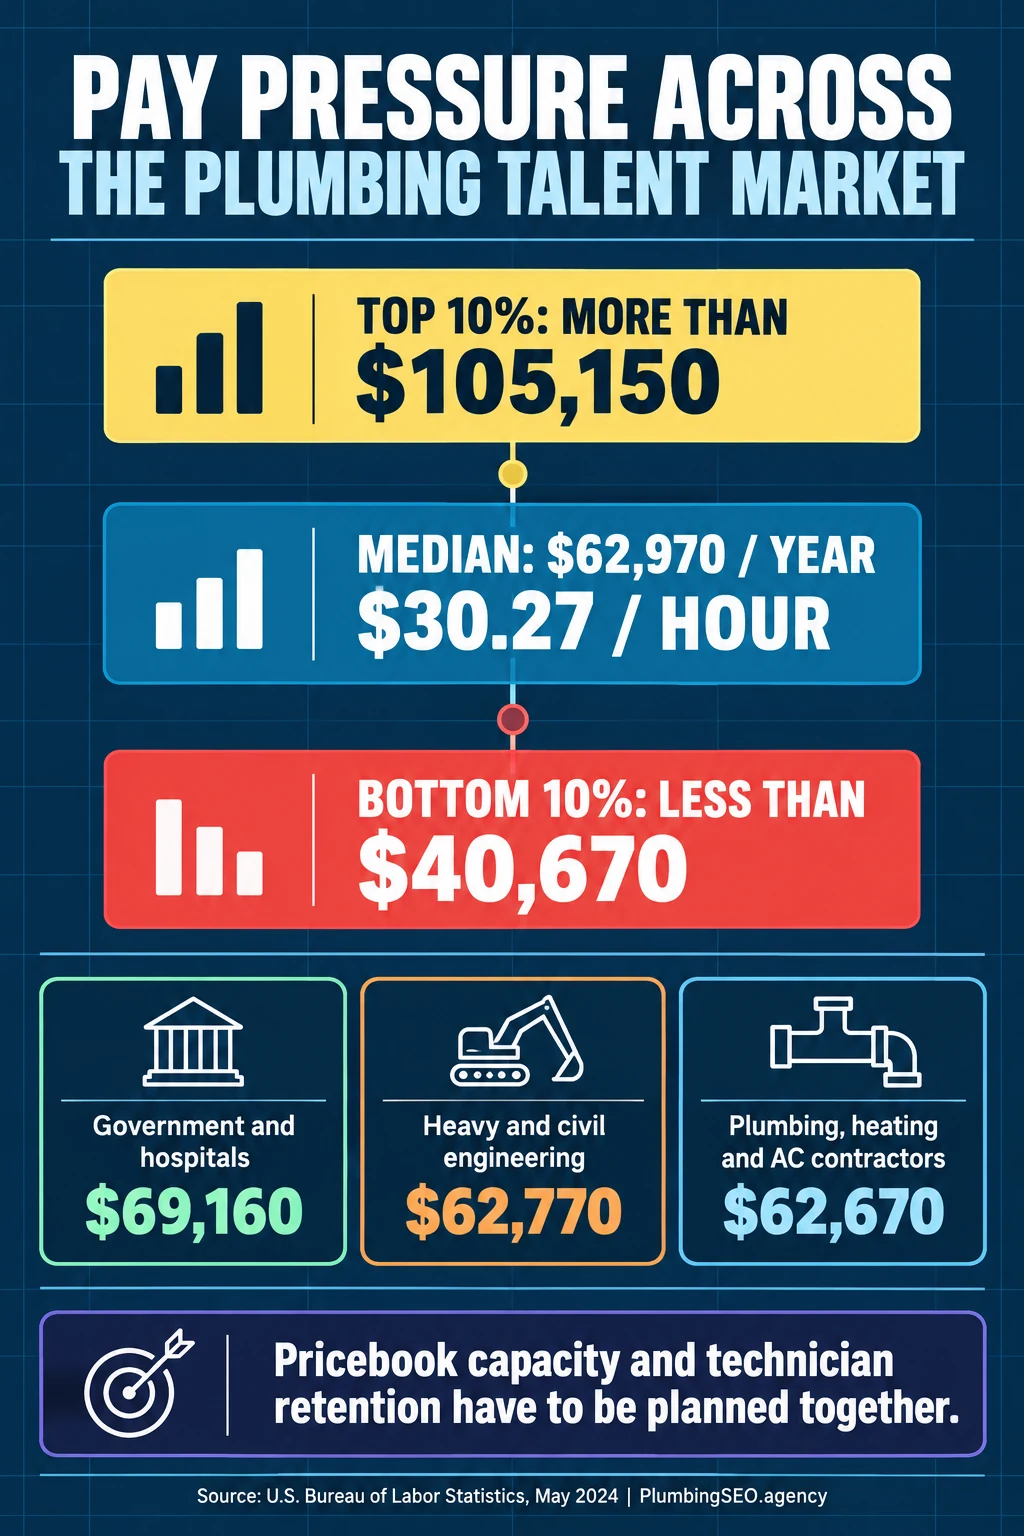
- The national median was $62,970 in May 2024, while the highest 10% earned more than $105,150. Shops chasing experienced talent need pricebook capacity to carry it.
1. Plumbing jobs, growth, and opening statistics
The headline growth rate is only one part of the hiring picture. A local company feels total openings. Those include new positions plus seats that open when experienced people change occupations or leave the labor force.
| # | Workforce benchmark | Value | Source | Meaning |
|---|---|---|---|---|
| 1 | Occupation employment | 504,500 jobs | BLS OOH | Plumbers, pipefitters and steamfitters, 2024 |
| 2 | Projected employment | 527,200 jobs | BLS OOH | 2034 projection |
| 3 | Projected growth rate | 4% | BLS OOH | 2024 to 2034 |
| 4 | Projected net employment change | 22,700 jobs | BLS OOH | Growth, not all hiring |
| 5 | Average annual openings | 44,000 | BLS OOH | Decade average |
| 6 | Typical entry education | High school diploma or equivalent | BLS OOH | Common entry baseline |
| 7 | Related prior work experience | None typically required | BLS OOH | Training occurs after entry |
| 8 | Typical training route | Apprenticeship | BLS OOH | Paid work plus instruction |
2. Where plumbers work and when the work happens
Contractors employ most of the trade, but they do not own the whole labor pool. Government, heavy construction, manufacturing, unions, industrial employers and self-employment all compete for people with overlapping skills.
| # | Employment or work-condition benchmark | Value | Source | Employer implication |
|---|---|---|---|---|
| 9 | Plumbing, heating and air-conditioning contractors | 66% of jobs | BLS OOH | Largest employer group |
| 10 | Self-employed workers | 8% of jobs | BLS OOH | Some experienced workers choose independence |
| 11 | Heavy and civil engineering construction | 4% of jobs | BLS OOH | Infrastructure competes for skill |
| 12 | Government employment | 3% of jobs | BLS OOH | Public jobs can offer a different package |
| 13 | Typical schedule | Most work full time | BLS OOH | Staffing capacity is measured in full weeks |
| 14 | Evening and weekend work | Common | BLS OOH | Scheduling affects retention |
| 15 | Emergency availability | On-call work may be required | BLS OOH | Rotate the burden clearly |
| 16 | Common injury exposures | Cuts, falls and burns | BLS OOH | Safety protects capacity |
3. Plumber apprenticeship duration and training benchmarks
An apprenticeship is not cheap labor with a textbook taped to the dashboard. It is a long production system. The shop must supply supervised hours, increasing responsibility, technical instruction, safe habits, records and a clear route toward examination and licensure.
| # | Apprenticeship benchmark | Value | Source | Scope |
|---|---|---|---|---|
| 17 | Typical plumbing apprenticeship | 4 to 5 years | BLS OOH | Occupation-wide description |
| 18 | Paid on-the-job training | About 2,000 hours each year | BLS OOH | Typical annual pace |
| 19 | PHCC curriculum duration | 4 years | PHCC Educational Foundation | Industry curriculum |
| 20 | PHCC related classroom instruction | 576 hours | PHCC Educational Foundation | Full curriculum |
| 21 | PHCC on-the-job learning | 8,000 hours | PHCC Educational Foundation | Full curriculum target |
| 22 | PHCC classroom pace | 144 hours per year | PHCC Educational Foundation | Four-year structure |
| 23 | United Association apprenticeship | 5 years | United Association | Union pathway |
| 24 | UA apprentice training | Up to 10,000 hours | United Association | Classroom and job learning |
| 25 | UA training network | More than 300 facilities | United Association | United States and Canada |
| 26 | Technical instruction topics | Safety, codes, blueprint reading and math | BLS OOH | Typical curriculum areas |
In the real world, mentor capacity is the choke point. One strong journeyman cannot train an unlimited number of helpers while running service, protecting quality, documenting hours and keeping callbacks off the board. Build apprentice intake around the number of people who can actually teach.
4. Registered Apprenticeship system benchmarks
National Registered Apprenticeship totals cover many occupations, not plumbing alone. They still show the size, operating model and measured outcomes of the system that plumbing programs use.
| # | Registered Apprenticeship benchmark | Value | Source | Context |
|---|---|---|---|---|
| 27 | Active apprentices | More than 679,000 | ApprenticeshipUSA | Fiscal 2024, all occupations |
| 28 | New apprentices | More than 280,000 | ApprenticeshipUSA | Fiscal 2024 entries |
| 29 | Program completers | More than 94,000 | ApprenticeshipUSA | Fiscal 2024 |
| 30 | Active Registered Apprenticeship programs | More than 27,000 | ApprenticeshipUSA | National system |
| 31 | New programs | More than 3,000 | ApprenticeshipUSA | Fiscal 2024 |
| 32 | Employment after completion | 90% | ApprenticeshipUSA | National program outcome |
| 33 | Average annual salary after completion | $80,000 | ApprenticeshipUSA | Across registered programs |
| 34 | Lifetime earnings advantage | More than $300,000 | ApprenticeshipUSA | Compared with peers |
| 35 | Employer return | $1.44 per $1 invested | ApprenticeshipUSA | Published program estimate |
| 36 | Credential | Nationally recognized and portable | U.S. Department of Labor | Registered program feature |
5. Plumbing and construction worker-shortage statistics
There is no single official count of “missing plumbers.” BLS measures employment and openings. Contractor groups model extra construction labor demand. Surveys report hiring friction. Industry publishers aggregate plumbing-specific claims. Read each number by its definition instead of stacking them into one scary headline.
| # | Shortage signal | Value | Source | Definition warning |
|---|---|---|---|---|
| 37 | Additional construction workers needed | 439,000 | Associated Builders and Contractors | 2025 model, beyond normal hiring |
| 38 | Additional construction workers needed | 499,000 | ABC | 2026 model forecast |
| 39 | Contractors struggling to fill hourly craft roles | 94% | Associated General Contractors | 2024 contractor survey |
| 40 | Firms reporting candidates lack needed skills | 62% | AGC | Reason positions stay open |
| 41 | Firms reporting candidate no-shows | 45% | AGC | Hiring-process friction |
| 42 | Firms reporting drug or background failures | 41% | AGC | Applicant screening issue |
| 43 | Projects delayed by worker shortages | 54% | AGC | Surveyed construction firms |
| 44 | Firms increasing base pay | 80% | AGC | Response to hiring pressure |
| 45 | Plumbing labor-shortage figure cited by industry roundup | 55% | ServiceTitan | Secondary industry compilation |
| 46 | Projected plumber shortage cited for 2027 | 550,000 | ServiceTitan | Not a BLS employment projection |
6. Plumbing workforce age and gender benchmarks
The demographic picture explains why recruiting only from the same old circle is a weak plan. The current trade remains heavily male, while the apprentice share reported for women is higher than the share in the established occupation. That is a pipeline signal, not proof that the gap has already closed.
| # | Demographic benchmark | Value | Source | Use |
|---|---|---|---|---|
| 47 | Average age of male plumbers | 41 | ServiceTitan industry compilation | Succession context |
| 48 | Average age of female plumbers | 40 | ServiceTitan industry compilation | Workforce age context |
| 49 | Women as a share of plumbers | About 2.5% | ServiceTitan industry compilation | Occupation representation |
| 50 | Women as a share of plumber apprentices | 13% | ServiceTitan industry compilation | Pipeline representation |
| 51 | Federal construction participation goal for women | 6.9% | U.S. Department of Labor OFCCP | Utilization goal, not a quota |
| 52 | Federal apprenticeship minority utilization | Based on local labor area | 29 CFR Part 30 | Registered program equal-opportunity framework |
Recruiting wider only works if the shop can keep people. Clear job expectations, properly sized PPE, safe facilities, fair dispatch, documented raises, respectful crews and a real complaint path matter after the application lands.
7. State and local plumber licensing benchmarks
“Licensed plumber” does not mean the same thing everywhere. Some states set statewide experience and exam rules. Some cities control the license. Specialty scopes can have different hour requirements. Always verify the authority where the work is performed.
| # | Jurisdiction benchmark | Value | Source | Scope |
|---|---|---|---|---|
| 53 | Texas Tradesman Plumber-Limited experience | 4,000 hours | Texas State Board of Plumbing Examiners | Supervised plumbing work |
| 54 | Texas Tradesman training course | 24 hours | TSBPE | Board-approved course |
| 55 | Texas Journeyman experience | 8,000 hours | TSBPE | Supervised plumbing work |
| 56 | Texas Journeyman training course | 48 hours | TSBPE | Board-approved course |
| 57 | California qualifying experience | 4 years | California CSLB | Journey-level or higher |
| 58 | California experience lookback | Within the prior 10 years | California CSLB | Contractor exam qualification |
| 59 | California contractor license bond | $25,000 | California CSLB | Bond requirement |
| 60 | Washington journey-level plumber training | 8,000 hours | Washington L&I | Certification route |
| 61 | Washington commercial or industrial minimum | 4,000 hours | Washington L&I | Part of journey-level hours |
| 62 | Washington residential plumber training | 6,000 hours | Washington L&I | Specialty certification route |
| 63 | New York City master plumber experience route | 7 years | NYC Department of Buildings | Experience under licensed supervision |
| 64 | NYC registered journeyman component | At least 2 years | NYC Department of Buildings | One qualification route |
For an employer, the practical move is a license matrix by employee and jurisdiction. Track registration, approved hours, school progress, exam eligibility, renewals and the work each credential can legally supervise. A spreadsheet nobody updates is not a system. It is office wallpaper.
8. Union, nonunion, and independent plumbing pathways
The trade has more than one route. Union programs combine signatory employers, joint training and collectively bargained conditions. Nonunion programs can be employer-sponsored, association-based or registered through another sponsor. Experienced plumbers may also become self-employed.
| # | Pathway benchmark | Value | Source | Interpretation |
|---|---|---|---|---|
| 65 | Construction workers who were union members | 10.3% | BLS Union Members | 2024 industry average, not plumbing only |
| 66 | Construction workers represented by unions | 11.0% | BLS Union Members | Members plus represented nonmembers |
| 67 | UA apprenticeship duration | 5 years | United Association | Union route |
| 68 | PHCC apprenticeship curriculum | 4 years | PHCC Educational Foundation | Contractor-association route |
| 69 | Self-employed occupation share | 8% | BLS OOH | Independent route |
| 70 | Registered Apprenticeship sponsor types | Employers, associations, unions and joint committees | U.S. Department of Labor | Programs can use different sponsors |
No single route is automatically best for every worker or company. Compare the actual package: supervision, classroom quality, wage progression, benefits, travel, work mix, credential portability, completion support and the amount of work available.
9. Pay benchmarks that explain workforce supply
This is not another salary roundup. These numbers belong here because the labor pipeline does not operate outside the pricebook. A company asking for licensed skill, emergency availability and clean customer service has to carry the compensation and productive hours that make the job sustainable.
| # | Compensation benchmark | Value | Source | Workforce use |
|---|---|---|---|---|
| 71 | Median annual pay | $62,970 | BLS, May 2024 | National baseline |
| 72 | Median hourly pay | $30.27 | BLS, May 2024 | Hourly baseline |
| 73 | Lowest 10% annual pay | Less than $40,670 | BLS, May 2024 | Lower end of occupation |
| 74 | Highest 10% annual pay | More than $105,150 | BLS, May 2024 | Experienced-talent pressure |
| 75 | Government and hospital median | $69,160 | BLS, May 2024 | Competing employer sector |
| 76 | Heavy and civil engineering median | $62,770 | BLS, May 2024 | Infrastructure comparison |
| 77 | PHAC contractor median | $62,670 | BLS, May 2024 | Closest local-contractor comparison |
| 78 | Manufacturing median | $61,620 | BLS, May 2024 | Industrial comparison |
Pay is not the only retention lever, but weak pay cannot be repaired with a pizza lunch and a motivational poster. Pair compensation with fair dispatch, usable trucks, maintained tools, predictable on-call rotation, training, clear advancement, safe work and enough qualified calls to keep hours steady.
10. Workforce benchmarks plumbing owners should track
National data tells you how hard the market may be. Your own operating numbers tell you where the leak is. A company that cannot separate recruiting, training, licensing, retention and demand will keep treating every staffing problem like a job-board problem.
| # | Owner-side benchmark | Value or cadence | Source | Action |
|---|---|---|---|---|
| 79 | Fatal construction work injuries | 1,075 | OSHA Commonly Used Statistics | 2023 national construction safety context |
| 80 | Fatal construction falls to a lower level | 421 | OSHA Commonly Used Statistics | Make fall prevention part of capacity planning |
| 81 | Licensing coverage | Most states require a license | CareerOneStop License Finder | Verify each jurisdiction and scope |
| 82 | Fatal construction struck-by incidents | 96 | OSHA Commonly Used Statistics | Reinforce vehicle, material and tool controls |
Recruiting
Track applicants by source, license level, service experience, response time, interview attendance and accepted offers.
Training
Track apprentice hours, classroom progress, mentor load, skills signed off, callbacks and exam readiness.
Licensing
Track registrations, approved experience, exams, renewals, continuing education and legal scope by service area.
Retention
Track tenure, overtime, on-call burden, pay progression, unplanned absences, safety events and exit reasons.
Capacity
Track booked calls per qualified tech, drive time, callback load, unfilled slots, after-hours demand and work turned away.
Demand
Track which service pages and local searches create jobs your current and future crew can actually perform.
A labor plan and a demand plan should meet in the same room. If you are building apprentice capacity, publish career information and show the work honestly. If you have qualified people but quiet routes, strengthen your plumbing SEO, service-area visibility and calls-to-booked-jobs tracking. Do not buy a flood of leads for work nobody can run.
11. Summary reference for all 82 benchmarks
| Rows | Category | Primary use | Main sources |
|---|---|---|---|
| 1–8 | Jobs and outlook | Recruiting demand | BLS employment projections |
| 9–16 | Employment mix and work conditions | Offer and schedule design | BLS Occupational Outlook Handbook |
| 17–26 | Plumbing apprenticeship | Training capacity | BLS, PHCC, United Association |
| 27–36 | Registered Apprenticeship | Program design and outcomes | ApprenticeshipUSA, U.S. DOL |
| 37–46 | Worker-shortage signals | Scenario planning | ABC, AGC, ServiceTitan |
| 47–52 | Demographics | Pipeline reach and retention | Industry compilation, DOL, federal regulations |
| 53–64 | Licensing differences | Compliance and advancement | Texas, California, Washington, New York City |
| 65–70 | Union and nonunion routes | Pathway comparison | BLS, UA, PHCC, DOL |
| 71–78 | Pay and labor supply | Retention and pricebook planning | BLS wage data |
| 79–82 | Owner scorecard | Safety, licensing and local operating decisions | OSHA, CareerOneStop |
Methodology and source notes
This article was published October 21, 2026. The total counts the 82 numbered rows once. Hero cards, charts, takeaways, figure labels and FAQ answers repeat selected benchmarks for navigation and interpretation but do not increase the count.
Government and first-party program pages received priority. BLS combines plumbers, pipefitters and steamfitters under one occupation, so national employment and wage figures are not service-plumber-only counts. Registered Apprenticeship totals include all occupations. Construction shortage models cover more than plumbing. Survey percentages describe respondents, not every contractor. Plumbing-specific demographic and shortage claims from an industry roundup are labeled as secondary compilation data.
Licensing examples are snapshots, not legal advice. Rules can change and may depend on scope, municipality, reciprocity, education, military credit or the date hours were earned. Verify the current board, department, adopted code and program sponsor before hiring, assigning work or promising exam eligibility.
- BLS Occupational Outlook Handbook
- BLS Occupational Employment and Wage Statistics
- ApprenticeshipUSA Data and Statistics
- ApprenticeshipUSA Employer Outcomes
- U.S. DOL Registered Apprenticeship
- PHCC Educational Foundation Apprenticeship
- United Association Apprenticeship
- ABC Construction Workforce Model
- AGC Workforce Survey
- ServiceTitan Plumbing Industry Statistics
- U.S. DOL OFCCP Apprenticeship Guidance
- 29 CFR Part 30
- Texas Tradesman Plumber-Limited Requirements
- Texas Journeyman Plumber Requirements
- California CSLB Experience Requirements
- California CSLB Bond Requirements
- Washington Plumber Certification
- NYC Master Plumber License
- BLS Union Membership by Industry
- CareerOneStop License Finder
- OSHA Commonly Used Statistics
Plumbing workforce statistics FAQ
BLS counted 504,500 jobs for plumbers, pipefitters and steamfitters in 2024. That combined occupation includes more than residential service plumbers.
There is strong evidence of hiring pressure, but no single official missing-plumber count. BLS projects 44,000 annual occupation openings. ABC models extra construction labor demand, while contractor surveys measure vacancies, applicant quality and project delays. Those are different measures.
BLS describes a typical four-to-five-year apprenticeship with about 2,000 paid on-the-job training hours per year. PHCC publishes a four-year curriculum, while the United Association describes a five-year route.
Yes. Registered Apprenticeship is paid employment with structured job learning, related instruction and progressive wage increases as skills grow.
No. Texas, Washington, California and New York City illustrate different hour, experience, exam, bond and scope rules. Always check the current authority where the work will be performed.
Track applicant source and response, apprentice hours and school progress, mentor capacity, license milestones, pay progression, on-call burden, tenure, callbacks, safety events, booked calls per qualified tech and work turned away.
Have the crew, but need steadier local demand?
Get a practical review of your service pages, Maps visibility, local proof and call path so qualified technicians have the right jobs on the board.
Run My Free SEO Leak Check