
- BLS reports median plumber pay of $62,970 per year, but the top 10% earn more than $105,150, so hiring experienced people needs real pricebook math.
- IBISWorld puts the U.S. plumbers industry at $191.4B in 2026 with about 129K businesses and no company over 5% share, which keeps local operators in the fight.
- Owner income depends less on one national average and more on booked calls, margins, payroll, callbacks, route density, and whether marketing turns into jobs on the board.
If you run a plumbing company, salary data is not just trivia. It tells you what good techs cost, what owners can realistically take home, where margin gets tight, and why one busy shop can still feel broke while another keeps the trucks moving and has cash left over.
This plumber salary and business income statistics roundup pulls together wage, revenue, market, valuation, hiring, and local demand benchmarks for 2026 planning. Use it when you are setting pay, pricing jobs, building a budget, comparing markets, or deciding how much to reinvest into plumbing SEO, reviews, service pages, and lead tracking.
Headline plumber salary and business income statistics
| Planning question | Benchmark answer | Source |
|---|---|---|
| What does a plumber make at the national median? | $62,970 per year, or $30.27 per hour. | BLS |
| How big is the U.S. plumbers market? | $191.4 billion in 2026. | IBISWorld |
| How many plumbing businesses compete in the U.S.? | About 129,000. | IBISWorld |
| What owner income range is commonly cited? | $70,000 to $120,000, with high-performing owners at $150,000 or more. | Housecall Pro |
| What do sold plumbing businesses show for median owner earnings? | $311,598 among BizBuySell plumbing business benchmarks. | BizBuySell |
Key takeaways for plumbing owners
- Plumber wages are solid, but owner income is a different animal. Payroll, callbacks, drive time, trucks, insurance, parts, and marketing all take their bite before the owner gets paid.
- The U.S. plumbing market is large and fragmented. IBISWorld reports no company over 5% share, which means local operators can still win if they run tight routes, price correctly, and show up where customers search.
- Labor remains the pressure point. BLS projects 44,000 openings per year, so recruiting and retention should be treated like a profit center, not a side chore.
- Valuation data shows the spread between revenue and owner earnings. A company can pass $1 million in revenue and still need disciplined margins to create real take-home income.
- Online visibility matters because market demand does not automatically land on your schedule. If your best jobs are leaking to another company, review your plumbing SEO statistics, Google Business Profile, local pages, and call tracking.
1. Plumber wage benchmarks for 2026 planning
The cleanest wage baseline is still the Bureau of Labor Statistics. The BLS Occupational Outlook Handbook reports median annual pay of $62,970 and median hourly pay of $30.27 for plumbers, pipefitters, and steamfitters in May 2024.
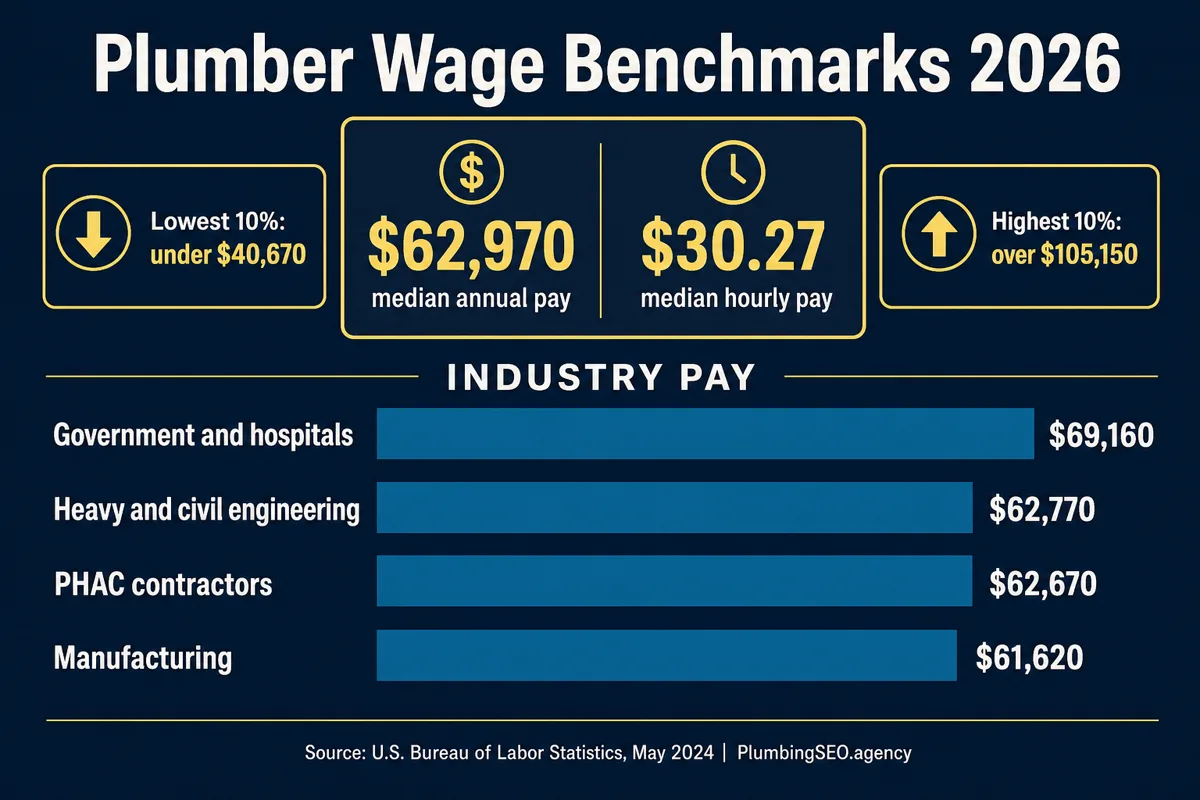
For an owner, the important part is not just the median. It is the spread. The lowest 10% earned less than $40,670, while the highest 10% earned more than $105,150. That spread tells you why a company with weak hiring systems can either underpay and lose good people, or overpay without enough billable work to support payroll.
| Wage benchmark | Value | Owner takeaway |
|---|---|---|
| Median annual pay | $62,970 | Use this as a baseline for budget modeling, not a ceiling. |
| Top 10% pay | More than $105,150 | Strong markets and specialized skill can command real money. |
| PHAC contractor median | $62,670 | This is close to the national median, so local pricing matters. |
| Apprenticeship training | 4 to 5 years, with about 2,000 paid training hours yearly | Your hiring plan needs patience, supervision, and a path to licensed production. |
2. Plumbing business income, market size, and valuation benchmarks
Owner income is not the same as plumber wages. A tech can look at an hourly rate. An owner has to look at revenue, gross margin, net margin, labor burden, booked calls, average ticket, callbacks, vehicle costs, and the slow weeks nobody puts in the brochure.
For market context, IBISWorld reports the U.S. plumbers industry at $191.4 billion in 2026, with about 129,000 businesses and a 3.1% market-size CAGR from 2021 to 2026. It also says no company holds more than 5% market share. In plain English, this is still a local operator market.
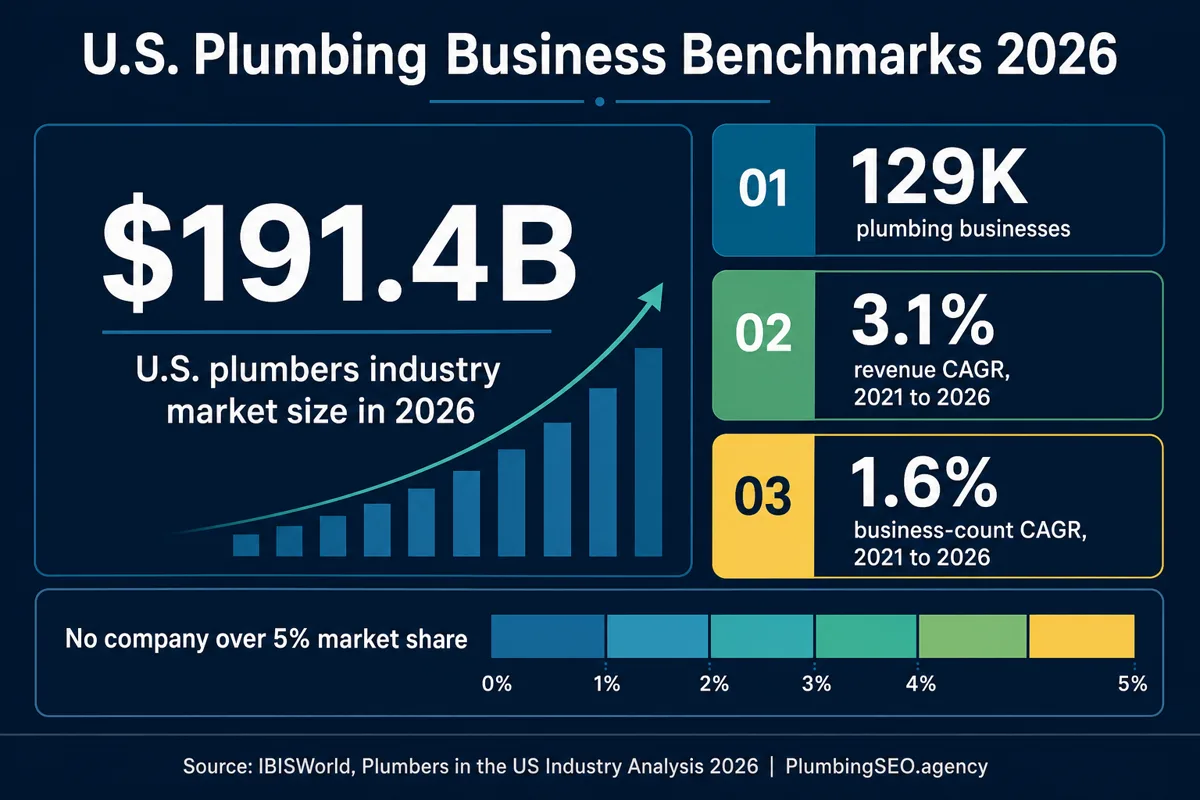
That fragmentation is good news if your company can answer calls, quote cleanly, and show up in the right service areas. It is bad news if your website is thin, your Google Business Profile is stale, and your dispatch board relies on hope and one paid ad account.
| Business benchmark | Value | Why it matters |
|---|---|---|
| Market size | $191.4B | Plumbing demand is large enough for strong local operators to grow. |
| Business count | 129K | The market is crowded, so trust signals and local proof matter. |
| Market CAGR | 3.1% | A growing market still punishes companies with weak pricing. |
| Median sold-business revenue | $1,174,514 | BizBuySell data shows where many mature small operators sit. |
| Median owner earnings | $311,598 | Owner income can beat technician pay, but only when margin survives the year. |
3. 88+ plumber wage, revenue, and market benchmarks
The table below includes more than 88 source-cited benchmarks. Some are direct wage or market values. Others are operating benchmarks that help explain why two plumbing companies with the same number of trucks can produce very different owner income.
| # | Benchmark | Value | Source |
|---|---|---|---|
| 1 | National median annual pay | $62,970 | BLS OOH, May 2024 |
| 2 | National median hourly pay | $30.27 | BLS OOH, May 2024 |
| 3 | Lowest 10 percent annual pay | under $40,670 | BLS OOH, May 2024 |
| 4 | Highest 10 percent annual pay | over $105,150 | BLS OOH, May 2024 |
| 5 | U.S. jobs held by plumbers, pipefitters, and steamfitters | 504,500 | BLS OOH, 2024 |
| 6 | Projected job growth | 4% | BLS OOH, 2024 to 2034 |
| 7 | Projected employment change | 22,700 jobs | BLS OOH, 2024 to 2034 |
| 8 | Projected annual openings | 44,000 per year | BLS OOH, decade average |
| 9 | Share employed by plumbing, heating, and air-conditioning contractors | 66% | BLS OOH, 2024 |
| 10 | Self-employed share | 8% | BLS OOH, 2024 |
| 11 | Heavy and civil engineering construction employment share | 4% | BLS OOH, 2024 |
| 12 | Government employment share | 3% | BLS OOH, 2024 |
| 13 | Government and hospital median wage | $69,160 | BLS OOH, May 2024 |
| 14 | Heavy and civil engineering median wage | $62,770 | BLS OOH, May 2024 |
| 15 | PHAC contractor median wage | $62,670 | BLS OOH, May 2024 |
| 16 | Manufacturing median wage | $61,620 | BLS OOH, May 2024 |
| 17 | Typical apprenticeship length | 4 to 5 years | BLS OOH |
| 18 | Annual paid on-the-job training during apprenticeship | 2,000 hours | BLS OOH |
| 19 | Typical entry-level education | High school diploma or equivalent | BLS OOH |
| 20 | Licensing condition | Most states require licensing | BLS OOH |
| 21 | Boilermaker median pay for trade comparison | $73,340 | BLS OOH related occupations |
| 22 | Construction and building inspector median pay | $72,120 | BLS OOH related occupations |
| 23 | Construction laborer median pay | $46,050 | BLS OOH related occupations |
| 24 | Construction manager median pay | $106,980 | BLS OOH related occupations |
| 25 | Electrician median pay | $62,350 | BLS OOH related occupations |
| 26 | General maintenance worker median pay | $48,620 | BLS OOH related occupations |
| 27 | HVAC mechanic and installer median pay | $59,810 | BLS OOH related occupations |
| 28 | Industrial machinery mechanic median pay | $63,510 | BLS OOH related occupations |
| 29 | Water transportation worker median pay | $66,490 | BLS OOH related occupations |
| 30 | Welder, cutter, solderer, and brazer median pay | $51,000 | BLS OOH related occupations |
| 31 | Reported plumber salary range in 2026 | $33,958 to $93,066 | FieldPulse |
| 32 | San Jose plumber salary benchmark | $99,570 | FieldPulse |
| 33 | New York City plumber salary benchmark | $93,650 | FieldPulse |
| 34 | Chicago plumber salary benchmark | $92,060 | FieldPulse |
| 35 | San Francisco plumber salary benchmark | $90,790 | FieldPulse |
| 36 | Boston plumber salary benchmark | $90,580 | FieldPulse |
| 37 | New Jersey plumber salary benchmark | $97,690 | FieldPulse |
| 38 | Massachusetts plumber salary benchmark | $89,140 | FieldPulse |
| 39 | Illinois plumber salary benchmark | $88,420 | FieldPulse |
| 40 | Oregon plumber salary benchmark | $85,680 | FieldPulse |
| 41 | New York state plumber salary benchmark | $84,890 | FieldPulse |
| 42 | Example desired base hourly earnings | $40 per hour | FieldPulse pricing example |
| 43 | Example first profit-margin add-on | 30% | FieldPulse pricing example |
| 44 | Example first add-on dollars | $12 | FieldPulse pricing example |
| 45 | Example rate after first add-on | $52 | FieldPulse pricing example |
| 46 | Example second overhead add-on | 25% | FieldPulse pricing example |
| 47 | Example second add-on dollars | $13 | FieldPulse pricing example |
| 48 | Example quoted hourly rate after add-ons | $65 | FieldPulse pricing example |
| 49 | Typical plumbing owner salary range | $70,000 to $120,000 | Housecall Pro |
| 50 | High-performing owner take-home potential | $150,000 or more | Housecall Pro |
| 51 | Owner pay depends on annual revenue | Yes | Housecall Pro |
| 52 | Owner pay depends on gross and net margins | Yes | Housecall Pro |
| 53 | BizBuySell plumbing listings analyzed | 226 | BizBuySell |
| 54 | Median days on market | 202 | BizBuySell |
| 55 | Median sale price | $638,730 | BizBuySell |
| 56 | Median asking price | $650,000 | BizBuySell |
| 57 | Median revenue for listed and sold plumbing businesses | $1,174,514 | BizBuySell |
| 58 | Median owner earnings | $311,598 | BizBuySell |
| 59 | Average revenue multiple | 0.67 | BizBuySell |
| 60 | Average earnings multiple | 2.49 | BizBuySell |
| 61 | Median business value increase, 2022 to 2025 | 46% | BizBuySell |
| 62 | 2025 median revenue pullback from 2024 peak | 29% | BizBuySell |
| 63 | 2025 median revenue after pullback | $1,044,630 | BizBuySell |
| 64 | 2025 profit margin noted in valuation data | 26.7% | BizBuySell |
| 65 | 2022 median transacted value | $572,500 | BizBuySell |
| 66 | 2025 median transacted value | $837,500 | BizBuySell |
| 67 | U.S. plumbers industry market size | $191.4 billion | IBISWorld, 2026 |
| 68 | U.S. plumbers industry businesses | 129,000 | IBISWorld, 2026 |
| 69 | Business-count CAGR | 1.6% | IBISWorld, 2021 to 2026 |
| 70 | Market-size CAGR | 3.1% | IBISWorld, 2021 to 2026 |
| 71 | Largest-company share threshold | No company over 5% | IBISWorld, 2026 |
| 72 | IBISWorld historical coverage | 2016 to 2031 | IBISWorld |
| 73 | IBISWorld publication date | February 2026 | IBISWorld |
| 74 | Earlier U.S. plumbing market value cited in 2025 roundup | $121.5 billion | ServiceTitan |
| 75 | Earlier five-year revenue CAGR cited in 2025 roundup | -2.1% | ServiceTitan |
| 76 | Europe plumbing and HVAC installation market size | €219.1 billion | ServiceTitan |
| 77 | Europe plumbing and HVAC installation market in USD | $231.78 billion | ServiceTitan |
| 78 | Global plumbing fixtures and fittings market value | $107.62 billion | ServiceTitan |
| 79 | Fixtures and fittings projected CAGR | 7.8% | ServiceTitan |
| 80 | Plumbing pipes projected CAGR | 14.69% | ServiceTitan |
| 81 | Nonresidential construction share of U.S. plumbing revenue | just over two-thirds | ServiceTitan |
| 82 | Top three U.S. plumbing companies combined 2024 revenue | over $956.6 million | ServiceTitan |
| 83 | Average age of male plumbers | 41 | ServiceTitan |
| 84 | Average age of female plumbers | 40 | ServiceTitan |
| 85 | Women as share of plumbers | around 2.5% | ServiceTitan |
| 86 | Women as share of apprentice plumbers | 13% | ServiceTitan |
| 87 | Average plumbing professional salary | $60,227 | ServiceTitan |
| 88 | Reported plumbing labor shortage | 55% | ServiceTitan |
| 89 | Reported annual economic cost of shortage | $33 billion | ServiceTitan |
| 90 | Expected plumber shortage by 2027 | 550,000 | ServiceTitan |
| 91 | Residential smart bathroom projected CAGR | 10.4% | ServiceTitan |
| 92 | Smart toilet market target by 2026 | $12.9 billion | ServiceTitan |
| 93 | Average annual household leak waste | almost 10,000 gallons | ServiceTitan citing EPA |
| 94 | Smart leak detector expected CAGR | 4.4% | ServiceTitan |
| 95 | Tankless water heater efficiency improvement | 8% to 34% | ServiceTitan citing Energy.gov |
| 96 | Google users clicking within nine seconds | 50% | ServiceTitan |
| 97 | Local queries resulting in Maps Pack clicks | 42% | ServiceTitan |
| 98 | Top organic result average CTR | 27.6% | ServiceTitan |
| 99 | Tenth organic result average CTR | 2.4% | ServiceTitan |
| 100 | Google search engine market share | around 82% | ServiceTitan |
| 101 | Local consumers looking at online reviews | 86% | ServiceTitan |
| 102 | Consumers reading business replies to reviews | 89% | ServiceTitan |
| 103 | Consumers trusting reviews as much as recommendations | 63% | ServiceTitan |
| 104 | Consumers finding small businesses on social media | 55% | ServiceTitan |
| 105 | Homeowner plumbing service hourly benchmark | $90 per hour | ServiceTitan |
| 106 | Customers influenced by positive reviews | 68% | ServiceTitan |
| 107 | Customers deterred by negative reviews | 40% | ServiceTitan |
| 108 | Financing revenue lift on plumbing jobs | more than 17% | ServiceTitan |
| 109 | Consumers more likely to buy from personalized brands | 76% | ServiceTitan |
| 110 | Customers expecting needs to be understood | 66% | ServiceTitan |
| 111 | North America smart bathroom share of global plumbing market | 47.9% | ServiceTitan |
4. How a plumbing owner should use these numbers
Do not read this data like a trivia list. Read it like a service board. Where are the leaks? Where is money getting stuck? Where are good calls going before they ever hit your phone?
Set wages from production, not guesswork
If your licensed tech pay is near the BLS median, your pricing, booking rate, and routing need to support it. If you are trying to hire top 10% talent, build the math around top 10% pay before you post the job. The market does not care if your old pricebook still feels comfortable.
Separate owner salary from company profit
Owner pay should not be whatever is left in the account after payroll clears. Compare your salary, retained earnings, and reinvestment separately. A healthy plumbing company pays the owner, funds training, keeps trucks reliable, and still has money to improve visibility.
Use local demand data before adding trucks
If your current service area is not producing enough booked calls, a new truck can make the problem more expensive. Before expanding, check the basics: Google Business Profile categories, review velocity, service-area pages, conversion tracking, and your local SEO statistics against the towns you actually want to serve.
Make marketing answer to revenue
Rankings are useful, but booked plumbing jobs pay the bills. Track lead source, call quality, booked-job rate, average ticket, and repeat work. If a campaign cannot connect back to jobs on the board, it is not finished. It is just a shiny report with a wrench missing.
If you want help checking where calls are leaking, start with the free audit. We will look at your site, Google Business Profile, reviews, service-area coverage, and obvious conversion gaps before recommending a plan.
Methodology and source notes
This roundup was built from public wage, market, business valuation, software industry, and plumbing industry sources available during June 2026 drafting. Priority went to government and primary industry data, especially BLS wage and employment data, followed by IBISWorld market figures, BizBuySell transaction benchmarks, and industry software reports that publish plumbing-specific operating data.
Some market-size figures differ by source because they define the plumbing market differently. For example, a pure plumbers-industry report, a fixtures-and-fittings report, and a plumbing technology roundup may all use different boundaries. When the definitions differ, this article labels the source and uses the benchmark for planning context rather than pretending every number measures the same thing.
| Source | Used for |
|---|---|
| U.S. Bureau of Labor Statistics | Wage, job, training, employment, and outlook benchmarks. |
| IBISWorld | U.S. plumbers industry market size, business count, and concentration. |
| BizBuySell | Sold and listed plumbing business valuation, revenue, and owner earnings benchmarks. |
| FieldPulse | City, state, and pricing-formula examples for owner planning. |
| Housecall Pro | Owner salary range and profit drivers. |
| ServiceTitan | Industry, technology, customer behavior, and marketing benchmarks. |
Frequently asked questions
The best baseline is the BLS median annual pay of $62,970 for plumbers, pipefitters, and steamfitters, with median hourly pay of $30.27. Owners should also study the top 10% figure above $105,150 because that is where hiring experienced talent can pressure pricing.
Housecall Pro cites a common owner salary range of $70,000 to $120,000, with high-performing owners at $150,000 or more. BizBuySell plumbing valuation data shows median owner earnings of $311,598 among its plumbing business benchmarks, but that depends on revenue, margins, team structure, and local demand.
Different sources define the market differently. A plumbers-industry report, a fixtures-and-fittings report, and a smart plumbing technology report may all measure different slices. Use the source label before comparing numbers directly.
Use wage data to build your pricebook, hiring plan, and production targets. If your pay scale rises, your booked-call rate, average ticket, routing, review quality, and callback control need to rise with it.
They show why local visibility matters. Wages, trucks, materials, and insurance all need steady booked work. Strong search visibility, review trust, service-area pages, and call tracking help a plumbing company turn market demand into jobs instead of letting that demand go to another shop.
Want to know where your plumbing calls are leaking?
Get a free plumbing SEO audit. We will check your Google Business Profile, service pages, reviews, local visibility, and conversion gaps so you can see what to fix first.
Run My Free SEO Leak Check