
- Local search is now daily behavior: 84% of consumers search online for local businesses daily, and 45% default to Google for local-specific searches.
- Trust signals decide who gets the call: 97% of consumers read local reviews, 89% expect owners to respond, and 80% are more likely to use a business that replies to every review.
- Contractors need a multi-channel local footprint: search, maps, reviews, mobile pages, photos, social profiles, and trade-specific service pages all affect whether homeowners choose you.
Home services SEO is no longer just a rankings project. For plumbing, HVAC, electrical, roofing, cleaning, remodeling, and other local contractors, it is the system that makes a business visible when a homeowner has intent, trust concerns, and an urgent reason to call.
This statistics roundup compiles 84+ source-cited benchmarks from local SEO, review, mobile, home-services, and labor-market sources. Use it to pressure-test your 2026 plan: where homeowners search, what they expect to see, what makes a Google Business Profile believable, and where contractors should fix visibility leaks first.
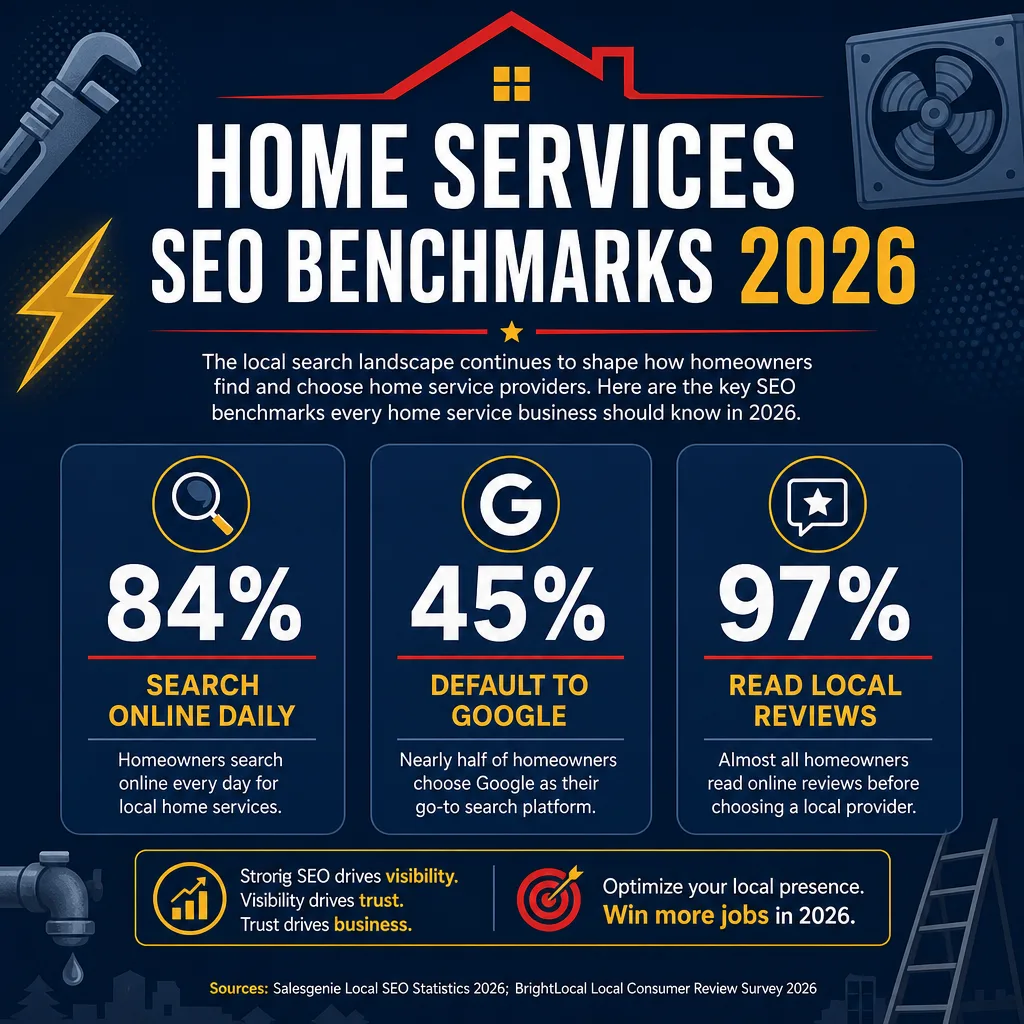
Headline home services SEO benchmarks for 2026: daily local search, Google-first discovery, and review-driven trust.
- 84% of consumers search online for local businesses daily [1].
- 45% of consumers default to Google for local-specific searches, while 15% start on Google Maps [1].
- 20% of default local search behavior happens on mapping platforms when Google Maps, Apple Maps, and Bing Maps are combined [1].
- 97% of consumers read reviews for local businesses [2].
- 89% of consumers expect business owners to respond to reviews, and 80% are more likely to use a business that responds to every review [1].
- 91% of U.S. adults own a smartphone, making mobile click-to-call and fast pages baseline requirements [1].
- Home services spending, bookings, and new business formation have expanded, which raises the visibility bar for contractors competing in crowded local markets [3].
- BLS projects 4% employment growth for plumbers and 9% growth for electricians from 2024 to 2034, showing continued trade demand [4] [5].
1. Local Search Demand Benchmarks for Home Services
Homeowners often search when they are ready to compare, call, book, or confirm whether a contractor looks legitimate. That is why SEO for plumbers and other contractors should start with demand capture, not vanity traffic.
| Benchmark | What it means for contractors | Source |
|---|---|---|
| 84% search online for local businesses daily | Local visibility is an everyday lead source, not an occasional discovery channel. | Salesgenie |
| 45% default to Google for local-specific searches | Google Search remains the central channel for high-intent contractor discovery. | Salesgenie |
| 15% use Google Maps first | Map visibility deserves its own optimization plan: categories, photos, hours, services, and proximity signals. | Salesgenie |
| 20% of default local behavior happens on mapping platforms combined | Google Maps, Apple Maps, and Bing Maps should carry consistent contractor data. | Salesgenie |
| 39% say at least 41% of their searches are local | Service-area pages need to match real cities, neighborhoods, and job types. | Salesgenie |
The practical takeaway: home service companies need accurate profiles and helpful pages for the jobs people actually search. A broad homepage rarely ranks or converts as well as focused service-area content, review proof, and clean call paths.
2. Review and Reputation Benchmarks
Reviews influence both trust and visibility. For a homeowner choosing between three contractors with similar services, review freshness, owner responses, star quality, and platform coverage can be the difference between a call and a lost job.
- 97%: Consumers read reviews for local businesses [2].
- 41%: Consumers always read reviews when browsing for businesses, up from 29% the prior year [2].
- 31%: Consumers will only use a business with a 4.5+ star rating, up from 17% [2].
- 89%: Consumers expect business owners to respond to reviews [1].
- 80%: Consumers are more likely to use a business that responds to every review [1].
- 42%: Consumers are unlikely to use a business that does not respond to reviews at all [1].
For contractors, this means review work cannot stop at asking for Google reviews. Yelp, Facebook, BBB, Apple Maps, Angi, niche directories, and AI-cited sources can all affect trust. If you already have a plumber-specific plan, compare it against our plumbing SEO statistics and local SEO for plumbers statistics guides for deeper trade-specific benchmarks.
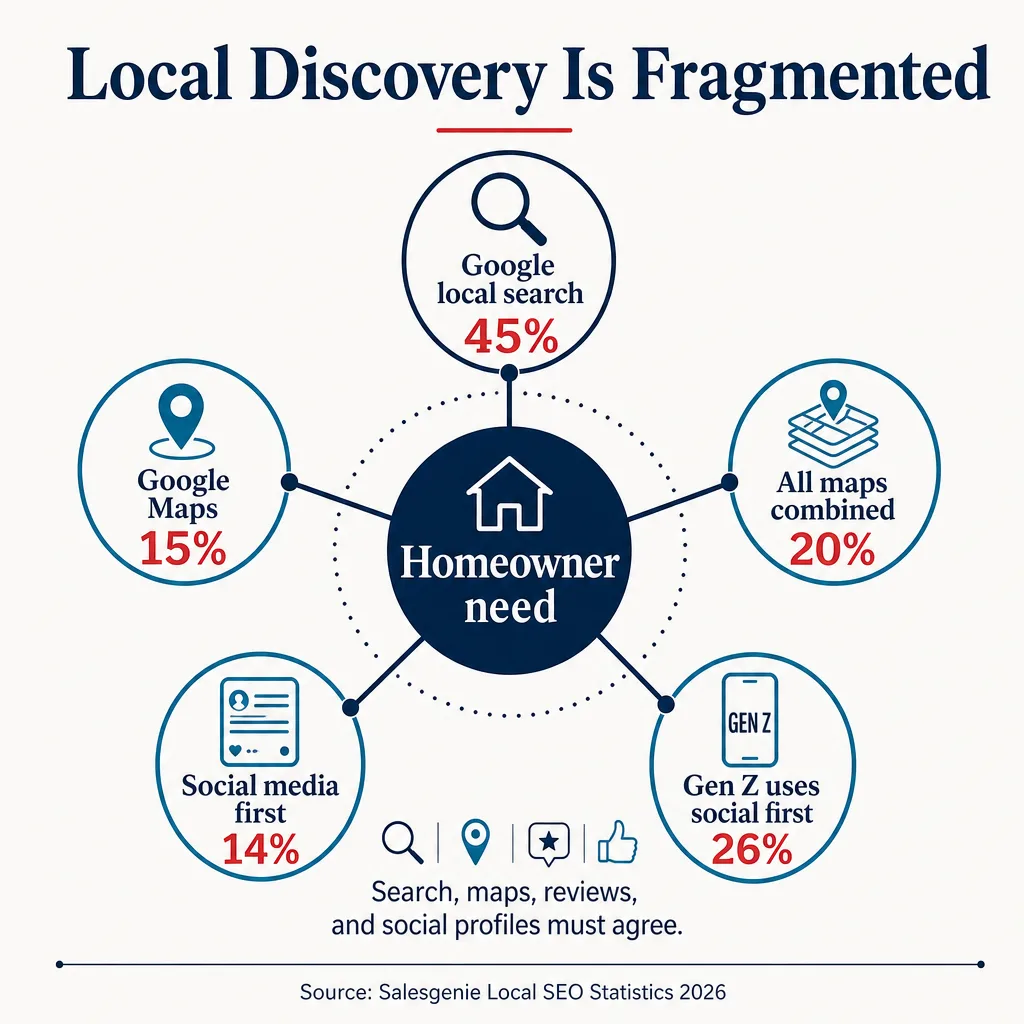
Homeowners do not use one discovery channel; search, maps, reviews, and social profiles need consistent business information.
3. Google Business Profile and Map Visibility Benchmarks
A verified, complete Google Business Profile helps contractors appear more reliable before the website click ever happens. It also supports the local ranking factors Google publicly describes: relevance, distance, and prominence.
| GBP or map benchmark | Contractor action | Source |
|---|---|---|
| Verified profiles are more likely to appear in search results | Claim and verify every legitimate location before advanced SEO work. | Salesgenie / Google |
| Profiles with 15+ photos per location saw stronger engagement | Upload real truck, team, job, equipment, and before/after photos. | Salesgenie |
| Retail brands saw GBP actions climb 11.3% from Q1 to Q3 last year | Track profile calls, website clicks, and direction requests by quarter. | Salesgenie |
| Healthcare clicks rose 6.6% year over year and direction requests rose 7.7% quarter over quarter | Service businesses should treat profile completeness as a conversion asset. | Salesgenie |
| Google's local system uses relevance, distance, and prominence | Align categories, service pages, citations, reviews, and geographic proof. | Salesgenie / Google |
Do not optimize a profile in isolation. If your website says one service area, directories say another, and reviews mention old brands or old towns, search engines and homeowners both get weaker trust signals.
4. Mobile, Social, and Multi-Platform Discovery Benchmarks
Home services customers often search from a phone while comparing choices quickly. The conversion path needs to be simple: confirm the contractor handles the job, see credible proof, tap to call, and book.
- 91%: U.S. adults own a smartphone [1].
- 16%: U.S. adults are smartphone-only internet users [1].
- 27%: U.S. adults ages 18 to 29 are smartphone dependent [1].
- 73%: Consumers use social media during their search for local businesses [1].
- 26%: Gen Z consumers use social media as their primary local search method [1].
- 3.6: Average number of platforms Gen Z consumers use before making a purchase decision [1].
For contractors, mobile SEO is not just page speed. It is call tracking, visible service areas, trust proof near the top of the page, readable pricing or estimate language, and a phone button that works from every important landing page.
5. Home Services Market and Trade Demand Benchmarks
SEO competition rises when market demand rises. Home services have seen more digital bookings, more new businesses, and more homeowners researching before they spend. That means the companies with the cleanest online proof tend to win earlier in the buying journey.
| Market benchmark | SEO implication | Source |
|---|---|---|
| 150% increase in home service bookings since the pandemic | More homeowners are comfortable booking services through digital paths. | ServiceTitan |
| 278,000 new home service businesses opened in the U.S. in 2023 | Local markets are more crowded; differentiation and review proof matter more. | ServiceTitan |
| 32% more new home service businesses year over year in 2023 | New competitors can enter maps and local organic results quickly. | ServiceTitan |
| 36% of consumers looked at two review sites before choosing a service business in 2024 | Contractors need review coverage beyond one platform. | ServiceTitan |
| 90% of consumers use smartphones for online searches | Mobile UX is a lead conversion factor. | ServiceTitan |
| Customers spend 17% more with a company that offers high-quality service | Review copy, proof photos, and service pages should communicate quality, not just availability. | ServiceTitan |
Lead flow is not only a traffic problem. It is also a trust, speed-to-answer, and operational proof problem. A contractor that ranks but does not answer calls, show current reviews, or explain its service area will leak jobs.
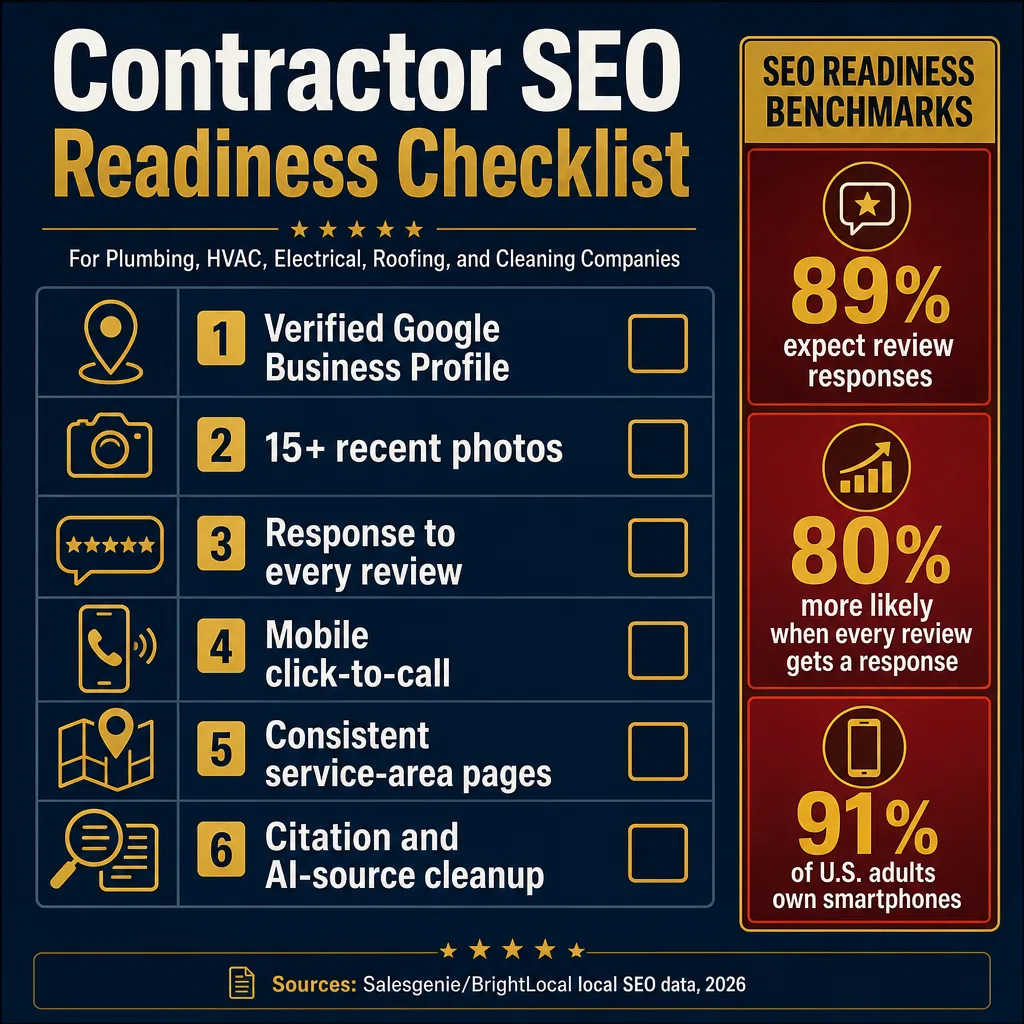
A practical SEO readiness checklist for contractors that connects local visibility to trust and booked jobs.
6. Master Table: 84 Home Services SEO Benchmarks
This table turns the research into a working checklist. Use it to audit your website, Google Business Profile, maps, review program, mobile experience, and service-area content.
| # | Benchmark | Source |
|---|---|---|
| 1 | 84% of consumers search online for local businesses daily. | Salesgenie |
| 2 | 39% of consumers estimate that at least 41% of their searches are local. | Salesgenie |
| 3 | 45% of consumers default to Google for local-specific searches. | Salesgenie |
| 4 | 15% of consumers use Google Maps as their first choice for local searches. | Salesgenie |
| 5 | 20% of default local search behavior happens on mapping platforms when Google Maps, Apple Maps, and Bing Maps are combined. | Salesgenie |
| 6 | 14% of consumers turn to social media first for local search. | Salesgenie |
| 7 | 26% of Gen Z consumers use social media as their primary local search method. | Salesgenie |
| 8 | Verified Google Business Profiles are more likely to appear in search results. | Salesgenie / Google |
| 9 | Retail brands saw Google Business Profile actions climb 11.3% from Q1 to Q3 last year. | Salesgenie |
| 10 | Healthcare brands saw Google Business Profile clicks rise 0.8% quarter over quarter. | Salesgenie |
| 11 | Healthcare brands saw Google Business Profile clicks rise 6.6% year over year. | Salesgenie |
| 12 | Healthcare direction requests increased 7.7% quarter over quarter. | Salesgenie |
| 13 | Financial services brands reported a 2.2% quarter-over-quarter increase in Google Business Profile clicks. | Salesgenie |
| 14 | Financial services brands reported a 4.5% increase in direction requests. | Salesgenie |
| 15 | Financial services brands reported a 2.0% increase in website clicks. | Salesgenie |
| 16 | Verified profiles with 15 or more photos per location saw stronger engagement across customer actions. | Salesgenie |
| 17 | 89% of consumers expect business owners to respond to reviews. | Salesgenie |
| 18 | 81% of consumers expect a response to a review within one week. | Salesgenie |
| 19 | 19% of consumers expect businesses to respond to reviews the same day. | Salesgenie |
| 20 | 80% of consumers are more likely to use a business that responds to every review. | Salesgenie |
| 21 | 42% are unlikely to use a business that does not respond to reviews at all. | Salesgenie |
| 22 | 91% of U.S. adults own a smartphone. | Salesgenie |
| 23 | 16% of U.S. adults are smartphone-only internet users. | Salesgenie |
| 24 | 27% of U.S. adults ages 18 to 29 are smartphone dependent. | Salesgenie |
| 25 | 73% of consumers use social media during their search for local businesses. | Salesgenie |
| 26 | Gen Z consumers use an average of 3.6 platforms before making a purchase decision. | Salesgenie |
| 27 | 97% of consumers read reviews for local businesses. | BrightLocal |
| 28 | The average consumer uses six different review sites when choosing businesses. | BrightLocal |
| 29 | 41% of consumers always read reviews when browsing for businesses. | BrightLocal |
| 30 | 29% of consumers always read reviews in the prior year benchmark. | BrightLocal |
| 31 | 31% of consumers will only use a business with 4.5+ stars. | BrightLocal |
| 32 | 17% of consumers required 4.5+ stars in the prior year benchmark. | BrightLocal |
| 33 | Google review-site usage dropped from 83% in 2025 to 71% in 2026. | BrightLocal |
| 34 | ChatGPT and AI tools for local recommendations rose from 6% to 45%. | BrightLocal |
| 35 | Apple Maps usage nearly doubled from 14% to 27%. | BrightLocal |
| 36 | Local news sites declined from 48% to 29% as a local recommendation source. | BrightLocal |
| 37 | 35% of SMBs have a Google Business Profile, according to BrightLocal research cited in the survey. | BrightLocal |
| 38 | Home services spending was expected to increase by $6.5 billion between 2023 and 2028. | ServiceTitan / Technavio |
| 39 | ServiceTitan cited a 40.34% CAGR for home services spending growth in that forecast. | ServiceTitan / Technavio |
| 40 | Construction spending surpassed $2 trillion. | ServiceTitan / Deloitte |
| 41 | Home service bookings increased 150% since the pandemic. | ServiceTitan / Amenify |
| 42 | 278,000 new home service businesses opened in the U.S. in 2023. | ServiceTitan / Yelp |
| 43 | There were 32% more new home service businesses year over year in 2023. | ServiceTitan / Yelp |
| 44 | AI and automation can save $720,000 in admin labor costs for planning and scheduling. | ServiceTitan / ABC |
| 45 | Businesses that lead with data see a 50% increase in profit growth. | ServiceTitan / Autodesk |
| 46 | Only 38% of construction data is collected and analyzed. | ServiceTitan / Autodesk |
| 47 | 24% of businesses benefit from data to improve site safety. | ServiceTitan / Autodesk |
| 48 | 65% of homeowners planned large investments in home projects. | ServiceTitan / Angi |
| 49 | Demand for carpenters grew by 54% in 2023. | ServiceTitan / Yelp |
| 50 | 50% of home service businesses struggle to find skilled talent. | ServiceTitan / Amenify |
| 51 | 36% of consumers looked at two review sites before choosing a service business in 2024. | ServiceTitan / BrightLocal |
| 52 | 90% of consumers use smartphones for online searches. | ServiceTitan |
| 53 | 73% of roofing customers find a contractor by word of mouth. | ServiceTitan / Roofing Contractor |
| 54 | Search engines ranked second for roofing contractor discovery at 54%. | ServiceTitan / Roofing Contractor |
| 55 | 82% of contractors plan to stand out with a good brand reputation. | ServiceTitan |
| 56 | Homeowners spent 51% more on home services projects in 2023 than in 2019. | ServiceTitan / Angi |
| 57 | Average household home-services spending reached $13,667 across 11 projects in 2023. | ServiceTitan / Angi |
| 58 | 40% of homeowners said rising interest rates were a factor in home improvements. | ServiceTitan / Angi |
| 59 | Demand for insulation increased 26% in 2023. | ServiceTitan / Plumbing & Mechanical |
| 60 | Demand for waterproofing increased 23% in 2023. | ServiceTitan / Plumbing & Mechanical |
| 61 | 51% of businesses plan to boost profitability by optimizing overhead costs. | ServiceTitan |
| 62 | 65% of home services projects over $5,000 are financed. | ServiceTitan / Joist |
| 63 | 25% of homeowners are interested in financing options through contractors. | ServiceTitan / Joist |
| 64 | Customers spend 17% more with a company that offers high-quality service. | ServiceTitan / Contracting Business |
| 65 | Businesses that focus on retention are 60% more profitable. | ServiceTitan / G2 |
| 66 | 41% of positive HVAC reviews cite courtesy and friendliness. | ServiceTitan / BBB |
| 67 | 15% of American homeowners installed solar panels in 2023. | ServiceTitan / Angi |
| 68 | Sales of heat pumps fell 17% in 2023. | ServiceTitan / MIT Technology Review |
| 69 | EPA refrigerant restrictions could increase HVAC equipment costs by 30%. | ServiceTitan / Aire Serv |
| 70 | Plumbers, pipefitters, and steamfitters earned median pay of $62,970 per year in May 2024. | BLS |
| 71 | Plumbers, pipefitters, and steamfitters earned median pay of $30.27 per hour in May 2024. | BLS |
| 72 | BLS projects 4% employment growth for plumbers, pipefitters, and steamfitters from 2024 to 2034. | BLS |
| 73 | BLS projects 22,700 employment change for plumbers, pipefitters, and steamfitters from 2024 to 2034. | BLS |
| 74 | Plumbing, heating, and air-conditioning contractors account for 66% of plumber employment by industry. | BLS |
| 75 | The highest 10% of plumbers, pipefitters, and steamfitters earned more than $105,150. | BLS |
| 76 | Electricians earned median pay of $62,350 per year in May 2024. | BLS |
| 77 | Electricians earned median pay of $29.98 per hour in May 2024. | BLS |
| 78 | BLS projects 9% employment growth for electricians from 2024 to 2034. | BLS |
| 79 | BLS projects 77,400 employment change for electricians from 2024 to 2034. | BLS |
| 80 | Electrical contractors and other wiring installation account for 65% of electrician employment by industry. | BLS |
| 81 | The highest 10% of electricians earned more than $106,030. | BLS |
| 82 | Research and Markets listed the home services market at $463.93B in 2026. | Research and Markets |
| 83 | Research and Markets projected the home services market to reach $652.67B by 2030. | Research and Markets |
| 84 | Research and Markets projected an 8.9% CAGR for the home services market. | Research and Markets |
Methodology and Source Notes
We reviewed current local SEO, review, Google Business Profile, home services, and labor-market sources, then grouped the findings by how a contractor can use them. Where a source summarized third-party data, the table names the visible source and the underlying organization when available.
The benchmarks are not a guarantee that one tactic will produce one fixed result. They are directional planning data. A contractor should combine them with call tracking, Google Business Profile insights, CRM close rates, and city-level keyword data before deciding budget.
| # | Source | Used for |
|---|---|---|
| 1 | Salesgenie: 23 Local SEO Statistics for 2026 | Local search, maps, reviews, mobile, social discovery. |
| 2 | BrightLocal: Local Consumer Review Survey 2026 | Review behavior, platforms, AI recommendations, star-rating expectations. |
| 3 | ServiceTitan: Home Services Industry Statistics | Home services market, bookings, competition, homeowner project demand. |
| 4 | BLS: Plumbers, Pipefitters, and Steamfitters | Trade pay, employment, and outlook benchmarks. |
| 5 | BLS: Electricians | Trade pay, employment, and outlook benchmarks. |
| 6 | Research and Markets: Home Services Market Report 2026 | Market size and growth forecast. |
Home Services SEO Statistics FAQ
The most important benchmarks are daily local search behavior, Google-first discovery, review trust, mobile usage, and profile completeness. Start with the numbers that affect calls: 84% of consumers search online for local businesses daily, 45% default to Google for local searches, 97% read reviews, and 91% of U.S. adults own smartphones.
Use them as an audit checklist. Verify the Google Business Profile, add current job photos, build service and city pages, improve mobile click-to-call paths, respond to reviews, and compare lead quality by source. Then connect those fixes to real calls and booked jobs in your CRM.
No. This roundup is cross-trade: plumbing, HVAC, electrical, roofing, cleaning, remodeling, and other local contractors. Plumbers can also use the plumber-specific statistics linked in the article for deeper local SEO and call-growth planning.
Prioritize named research publishers, government labor data, platform documentation, and sources that clearly explain sample or methodology. In this article, the core sources include Salesgenie, BrightLocal, ServiceTitan, BLS, and Research and Markets.
Fix the assets closest to calls first: Google Business Profile accuracy, service categories, recent photos, review responses, mobile page speed, click-to-call buttons, and top service-area pages. Those elements support both search visibility and homeowner trust.
Want to turn these benchmarks into more booked jobs?
Get a plumbing-focused SEO leak check that reviews your Google Business Profile, service pages, calls, reviews, and local visibility gaps.
Book a Free SEO Leak Check