
- Water damage/freezing claims hit about 1 in 60 insured homes each year, with average claim amounts reaching five figures.
- Emergency plumber costs climb fast after hours, on weekends, and on holidays. Publish honest ranges and explain what changes the bill.
- For owners, the fix is practical: strong emergency pages, accurate GBP hours, click-to-call, call tracking, and review proof.
If a homeowner has water coming through a ceiling, they are not in a research mood. They are trying to stop damage, calm the house down, and find a plumber who will answer the phone. That is why emergency plumbing statistics matter. They show the cost pressure behind the call.
This guide compiles 81+ demand, cost, leak, insurance, and local-search benchmarks from insurance, government, cost, labor, and local search sources. Use it to plan emergency service pages, Google Business Profile hours, call tracking, review proof, and the kind of content that helps the right customer call before the damage gets worse.
- Water damage and freezing claims affect roughly 1 in 60 insured homes per year. [1]
- The average water damage/freezing claim reached $15,400 in 2019-2023 claim data. [2]
- Just 1 inch of water can cause up to $25,000 in home damage. [2]
- The average household leak can waste 10,000+ gallons each year, and nationwide household leaks waste 1 trillion+ gallons. [4]
- Emergency plumbers commonly cost $100-$500 per hour, with an Angi average of $170 per hour. [5]
- HomeGuide puts after-hours emergency plumbing at $120-$300 per hour, weekends at $150-$350, and holidays at $200-$450+. [6]
- The U.S. had 504,500 plumber, pipefitter, and steamfitter jobs in 2024, with 4% projected growth from 2024 to 2034. [7]
- Emergency plumbing is a phone-first local search problem. 78% of mobile local searchers visit or call within 48 hours. [8]
1. Water Damage Claim Frequency and Severity
Water damage is not a small inconvenience in the insurance data. It is one of the common property claim categories, and the dollar amounts explain why homeowners move fast when a pipe lets go.
- 1 in 60: insured homes file a water damage or freezing claim annually. [1]
- $15,400: average water damage/freezing claim from 2019-2023 data summarized by This Old House. [2]
- 22.6%: share of home insurance claims tied to water damage or freezing in that same summary. [2]
- $25,000: damage that just one inch of water can cause in a typical home. [2]
- 14,000: estimated daily U.S. water damage events affecting people or properties. [3]
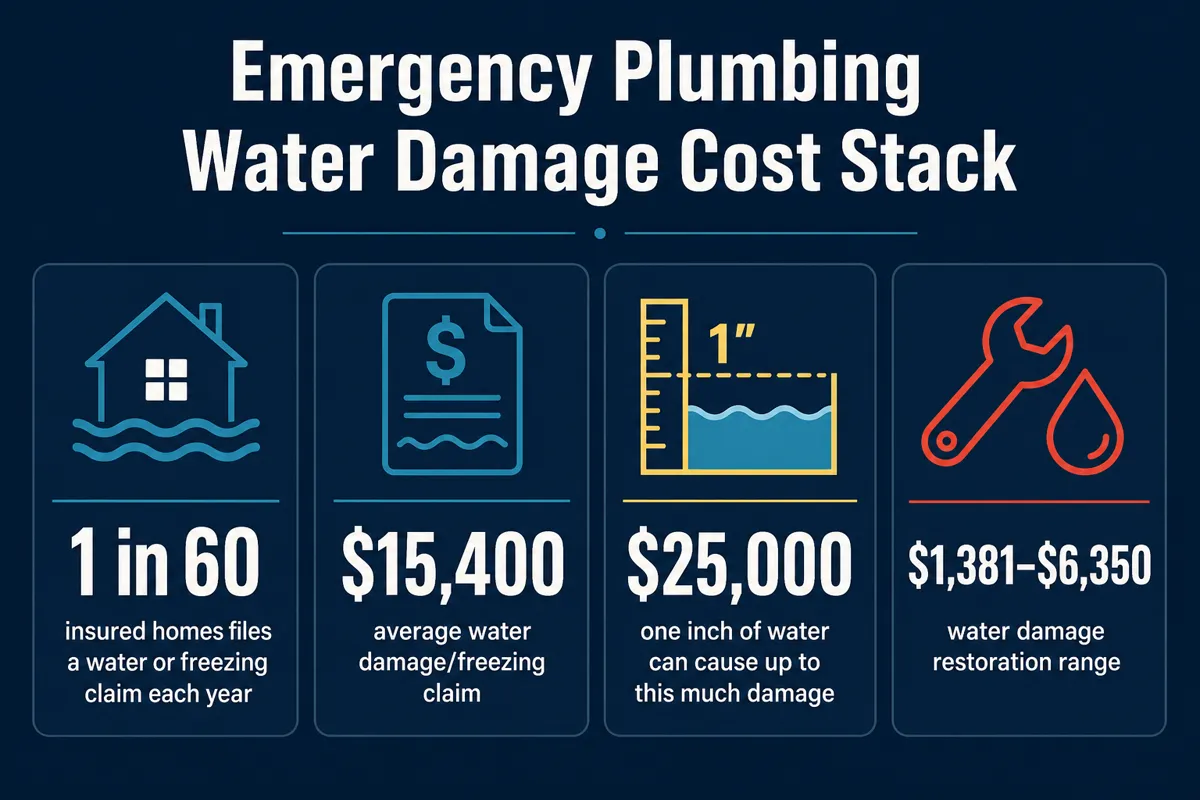
The cost stack behind an emergency plumbing call: frequent claims, five-figure damage risk, and repair costs that grow when mitigation is slow.
For a plumbing owner, the practical lesson is simple. Your emergency page should not just say “24/7 plumber.” It should explain burst pipes, shutoff steps, what is usually sudden and accidental, what the customer should photograph, and when to call. That builds trust before your dispatcher picks up.
2. Leak and Prevention Statistics
The EPA numbers are useful because they turn a hidden plumbing problem into something a homeowner can picture. A small drip is not just annoying. It can be thousands of gallons gone before anyone notices.
- 10,000+ gallons: average household leak waste per year. [4]
- 1 trillion+ gallons: annual national waste from household leaks. [4]
- 10%: homes with leaks wasting 90 gallons or more per day. [4]
- 10% savings: what homeowners may save on water bills by fixing easy leaks. [4]
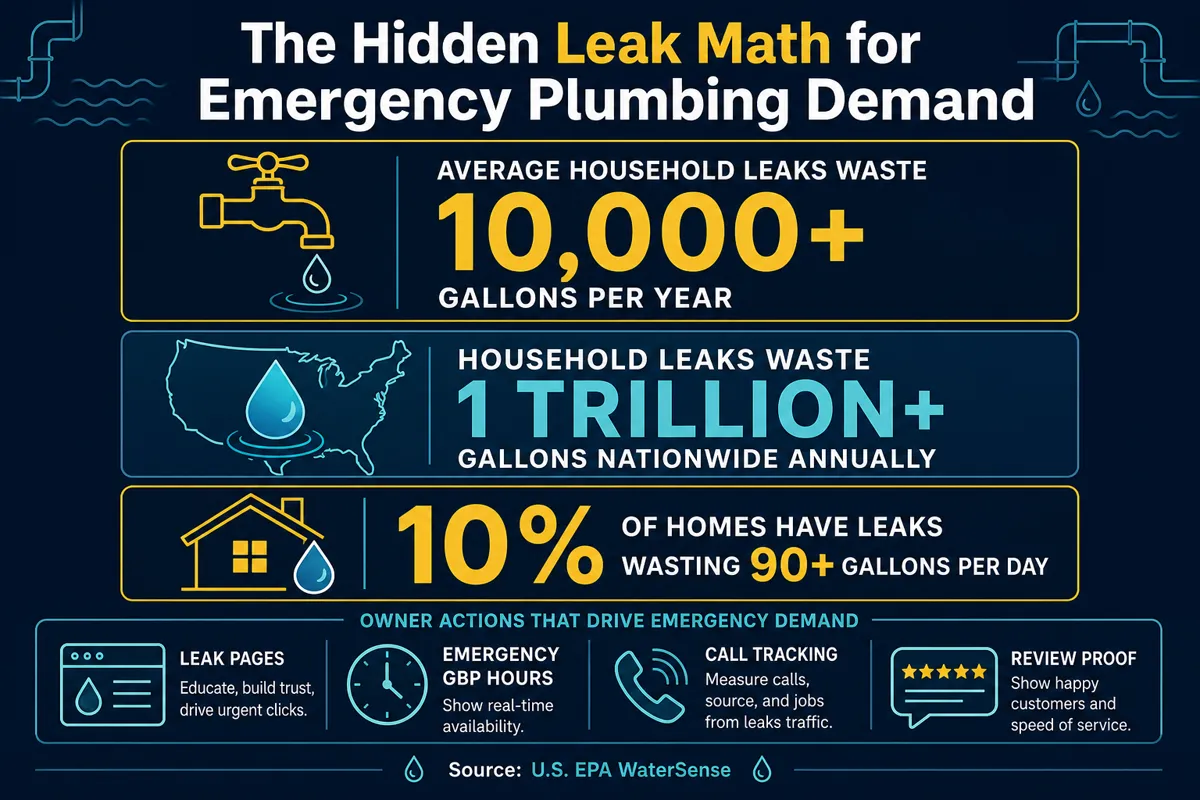
Leak statistics give plumbing companies a useful education angle before the problem becomes an emergency call.
In my opinion, leak detection pages are some of the most underused pages on plumbing websites. They catch the customer before the ceiling stain gets bigger, and they naturally connect to emergency plumbing, repipes, fixture repair, and water heater service.
3. Emergency Plumber Cost Benchmarks
Emergency plumbing pricing is not one number. Timing, access, parts, severity, and local labor rates all move the bill. That is why a clear cost page can earn trust while the customer is still deciding who to call.
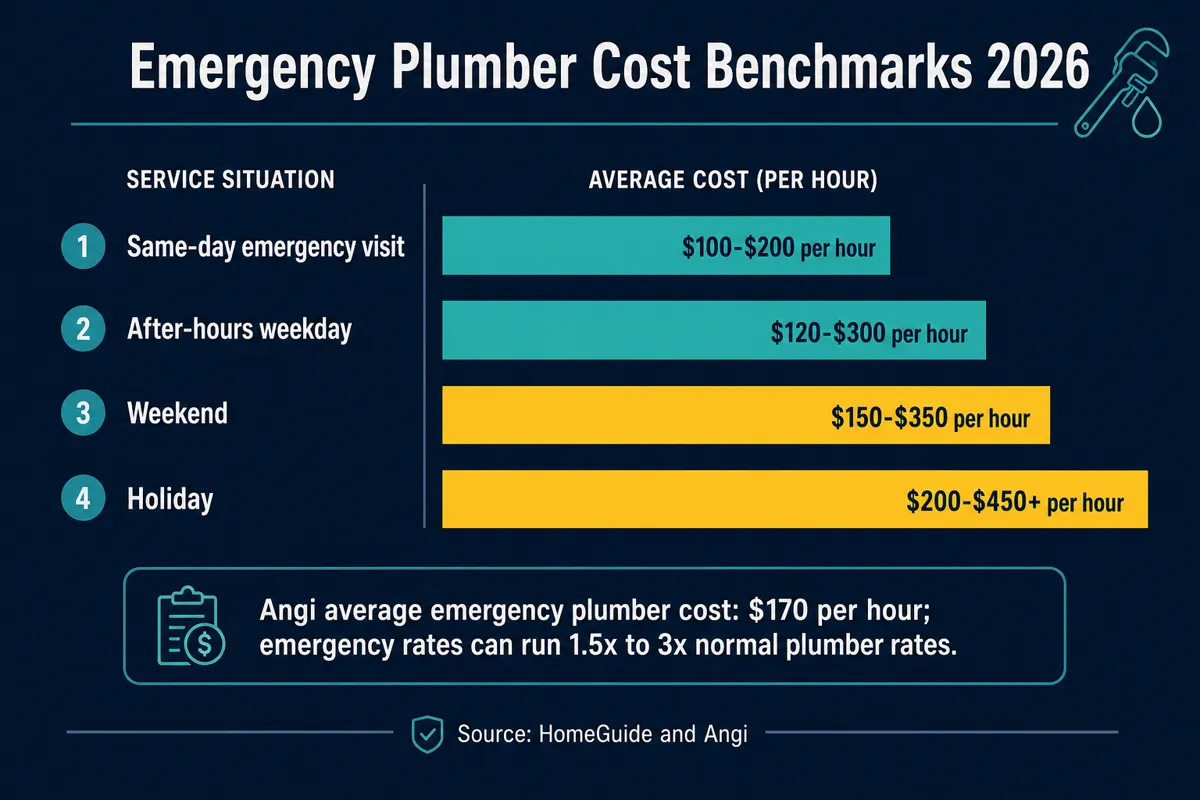
Emergency plumbing rates climb as timing gets harder and available labor gets tighter.
| Emergency situation | Typical benchmark | Source |
|---|---|---|
| Same-day emergency visit | $100-$200 per hour | [6] |
| After-hours weekday | $120-$300 per hour | [6] |
| Weekend emergency | $150-$350 per hour | [6] |
| Holiday emergency | $200-$450+ per hour | [6] |
| Burst or leaking pipe | $500-$5,000 depending on location and severity | [6] |
Do not hide every number behind “call for price.” A range with plain-English qualifiers is usually better. Tell the customer what changes the cost: after-hours dispatch, wall access, shutoff issues, pipe material, cleanup, restoration, and whether the problem is still active.
4. Labor and Capacity Benchmarks
The emergency plumbing market depends on trained labor. The Bureau of Labor Statistics counted 504,500 plumber, pipefitter, and steamfitter jobs in 2024 and projected 4% growth from 2024 to 2034. [7]
- $62,970: 2024 median annual pay. [7]
- $30.27: median hourly pay. [7]
- 22,700: projected employment change from 2024 to 2034. [7]
- Apprenticeship: typical on-the-job training path. [7]
For owners, this is an operations reminder as much as a marketing reminder. If your page promises 24-hour response, your dispatch, call handling, and routing have to support it. SEO can make the phone ring. It cannot teleport a licensed tech across town. If only it could, we would all sleep more.
5. Local Search and Call Readiness Benchmarks
Emergency plumbing demand turns into revenue only when search visibility, trust, and call handling line up. Local SEO is not just a ranking report here. It is the path from a wet floor to a booked truck.
- 46%: of Google searches have local intent. [8]
- 64%: of local searches happen on mobile devices. [8]
- 78%: of mobile local searchers visit or call within 48 hours. [8]
- 97%: of consumers read online reviews for local businesses. [9]
That is why emergency plumbing pages need four things working together: a fast mobile page, click-to-call, proof that you serve the city, and a Google Business Profile that matches the promise. For the wider strategy, see our SEO for plumbers guide, our plumbing SEO statistics, and our local SEO for plumbers statistics.
6. Master Table: 81+ Emergency Plumbing and Water Damage Benchmarks
Use this table as a working reference when building emergency plumbing pages, water damage pages, FAQs, ads, call scripts, and owner dashboards.
| # | Benchmark | Value or meaning | Source |
|---|---|---|---|
| 1 | Water damage/freezing claims | 1 in 60 insured homes file this type of claim annually | [1] |
| 2 | Average water/freezing claim | $15,400 average claim amount from 2019-2023 data | [2] |
| 3 | Share of claims | 22.6% of home insurance claims were water damage or freezing | [2] |
| 4 | One inch of water | Up to $25,000 in damage to a typical home | [2] |
| 5 | Daily water damage events | About 14,000 U.S. people are affected by water damage daily | [3] |
| 6 | Water damage restoration range | $1,381 to $6,350 typical range | [3] |
| 7 | Average insurance payout | $13,954 average water damage payout in RubyHome roundup | [3] |
| 8 | Flood reach | 99% of U.S. counties had a flood event between 1996 and 2019 | [3] |
| 9 | Basement exposure | 98% of U.S. basements may experience some water damage at least once | [3] |
| 10 | Average household leaks | 10,000+ gallons wasted per year | [4] |
| 11 | National household leaks | 1 trillion+ gallons wasted annually nationwide | [4] |
| 12 | High-waste homes | 10% of homes have leaks wasting 90+ gallons per day | [4] |
| 13 | Water bill savings | Fixing easy household leaks can save about 10% on water bills | [4] |
| 14 | Serious leak clue | Family of four using more than 12,000 gallons in winter may have a serious leak | [4] |
| 15 | Toilet dye test | Color appearing in 10 minutes means the toilet has a leak | [4] |
| 16 | Angi emergency plumber range | $100-$500 per hour for emergency plumbing service | [5] |
| 17 | Angi average emergency rate | $170 per hour average emergency plumber cost | [5] |
| 18 | Extreme emergency labor | Emergency plumbers may charge upward of $600 per hour in extreme cases | [5] |
| 19 | Emergency multiplier | Emergency rates can be 1.5x to 3x normal plumber rates | [5] |
| 20 | Normal plumber labor | $40-$200 per hour depending on market and experience | [5] |
| 21 | HomeGuide emergency rate | $100-$350 per hour average emergency plumber cost | [6] |
| 22 | HomeGuide service call | $150-$250 service call or after-hours surcharge | [6] |
| 23 | Same-day emergency visit | $100-$200 per hour during business hours | [6] |
| 24 | After-hours weekday | $120-$300 per hour | [6] |
| 25 | Weekend emergency | $150-$350 per hour | [6] |
| 26 | Holiday emergency | $200-$450+ per hour | [6] |
| 27 | Burst or leaking pipe repair | $500-$5,000 depending on access and severity | [6] |
| 28 | Plumber workforce | 504,500 plumber, pipefitter, and steamfitter jobs in 2024 | [7] |
| 29 | Median plumber pay | $62,970 per year | [7] |
| 30 | Median hourly pay | $30.27 per hour | [7] |
| 31 | Employment outlook | 4% projected job growth from 2024 to 2034 | [7] |
| 32 | Projected openings | 22,700 employment change from 2024 to 2034 | [7] |
| 33 | Entry path | High school diploma or equivalent plus apprenticeship is typical | [7] |
| 34 | Flood annual cost | Flood damage is described as the most costly insurance event, exceeding $180B annually | [2] |
| 35 | Sudden water coverage | Homeowners policies commonly cover sudden accidental water damage, not gradual leaks or external flood | [2] |
| 36 | Common damage causes | Leaky roofs, hidden leaks, clogged gutters, frozen pipes, faulty HVAC/plumbing, tub or toilet overflow, and sump pump failures | [2] |
| 37 | Emergency access factor | Wall, slab, underground, and ceiling access can push burst-pipe work higher | [6] |
| 38 | Repair complexity factor | Parts, access, labor time, and timing drive final emergency plumbing bills | [5] |
| 39 | Local rate factor | Local labor rates affect emergency plumber cost | [5] |
| 40 | Safety factor | Fast diagnosis helps prevent further damage and keep the household safe | [5] |
| 41 | Mobile local search | 64% of local searches happen on mobile devices | [8] |
| 42 | Local intent | 46% of Google searches carry local intent | [8] |
| 43 | Mobile action speed | 78% of mobile local searchers visit or call within 48 hours | [8] |
| 44 | Review reading | 97% of consumers read online reviews for local businesses | [9] |
| 45 | Recent review pressure | Customers heavily value recent review activity when choosing local businesses | [9] |
| 46 | Google review channel | Google remains the dominant review and discovery channel for local businesses | [9] |
| 47 | Emergency availability signal | Accurate hours and 24-hour availability help urgent customers decide who to call | [8] |
| 48 | Map pack trust | Local pack visibility combines proximity, relevance, and prominence signals | [10] |
| 49 | GBP management | Business profile completeness affects local discovery and customer actions | [10] |
| 50 | Service area relevance | Clear service-area pages help match emergency searches by city and neighborhood | [10] |
| 51 | Call tracking need | Emergency searches need source-level call tracking because phone calls are the conversion | [10] |
| 52 | Review response need | Owners should respond to reviews because customers read the business response | [9] |
| 53 | Damage urgency | Water damage grows more expensive when mitigation is delayed | [2] |
| 54 | Pipe freeze risk | Water damage and freezing are grouped together in insurance claim data | [1] |
| 55 | Claim frequency trend | Water and freezing claims remain among the most common property damage categories | [1] |
| 56 | Storm overlap | Flood and storm events can create emergency plumbing demand spikes | [2] |
| 57 | Leak page opportunity | Leak detection content maps to 10,000-gallon annual household waste problems | [4] |
| 58 | Toilet repair opportunity | Toilet flappers are among common correctable household leaks | [4] |
| 59 | Faucet repair opportunity | Dripping faucets are among common correctable household leaks | [4] |
| 60 | Valve repair opportunity | Other leaking valves are common correctable household leaks | [4] |
| 61 | Fixture upgrade opportunity | WaterSense fixtures can eliminate many common leaks after retrofit | [4] |
| 62 | Winter demand signal | Winter water use can reveal leak problems before damage escalates | [4] |
| 63 | Insurance education need | Flood damage typically needs separate coverage from homeowners insurance | [2] |
| 64 | Restoration budget floor | Even typical restoration ranges start above $1,300 | [3] |
| 65 | Restoration budget ceiling | Typical restoration ranges can exceed $6,000 before specialty conditions | [3] |
| 66 | High-damage scenario | One inch of water can turn a small leak into a five-figure customer problem | [2] |
| 67 | Consumer speed | Mobile emergency customers are usually ready to call, not browse slowly | [8] |
| 68 | GBP hour accuracy | Wrong hours can waste the highest-intent emergency searches | [10] |
| 69 | Photo proof | Photos of trucks, crew, and completed work increase trust for urgent local decisions | [10] |
| 70 | Insurance wording | Sudden and accidental phrasing matters for customer education pages | [2] |
| 71 | Emergency page CTA | Click-to-call placement matters more on emergency pages than long forms | [8] |
| 72 | Plumbing employment scale | More than half a million workers support national plumbing service demand | [7] |
| 73 | Apprenticeship reality | Labor supply depends on apprenticeship pipelines, not instant hiring | [7] |
| 74 | Owner capacity | After-hours calls require dispatch planning because labor is scarcer and more expensive | [5] |
| 75 | Holiday pricing | Holiday emergencies can run $200-$450+ per hour before surcharges | [6] |
| 76 | Weekend pricing | Weekend emergencies can run $150-$350 per hour before service-call fees | [6] |
| 77 | After-hours pricing | Weekday after-hours emergencies can run $120-$300 per hour | [6] |
| 78 | Same-day pricing | Same-day business-hour emergency calls can run $100-$200 per hour | [6] |
| 79 | Burst pipe upper range | Burst or leaking pipe repair can reach $5,000 before broader restoration | [6] |
| 80 | Claim severity | Average water/freezing claim amounts show why homeowners shop urgently | [2] |
| 81 | Leak prevention ROI | Saving 10% on the water bill is a customer-facing benefit of easy leak fixes | [4] |
| 82 | Search-to-call fit | Emergency plumbing is a local, mobile, high-intent search category | [8] |
| 83 | SEO action priority | Emergency pages should pair service-area relevance, GBP accuracy, reviews, and click-to-call | [10] |
How Plumbing Owners Should Use These Numbers
Do not turn this into a trivia page. Turn it into operations. Here is the practical order I would fix first:
- Emergency page first. Build one strong emergency plumbing page with service areas, shutoff steps, pricing ranges, and click-to-call above the fold.
- Water damage support pages second. Add burst pipe, slab leak, toilet overflow, water heater leak, and leak detection pages that answer the customer’s next question.
- Google Business Profile accuracy third. Hours, emergency attributes, service categories, photos, and review responses need to match the promise.
- Track the phone. If calls are the job, call tracking is the scoreboard.
- Use reviews like dispatch proof. Fast response, clean work, and calm communication should show up in the review profile.
Want to see where emergency calls are leaking?
We can review your emergency plumbing visibility, service-area pages, Google Business Profile, and call path. No jargon. Just what is blocking the phone.
Request a Plumbing SEO ReviewThis resource compiles emergency plumbing, water damage, leak, insurance, labor, and local-search benchmarks from public source pages reviewed in June 2026. Where a source summarizes another institutional dataset, the original institution is named when available and the linking source is listed below for reader verification.
- [1] Insurance Information Institute: Homeowners and renters insurance facts
- [2] This Old House: Water Damage Statistics and Information
- [3] RubyHome: Water Damage Statistics
- [4] U.S. EPA WaterSense: Leak Facts
- [5] Angi: Emergency Plumber Cost
- [6] HomeGuide: Emergency Plumber Cost
- [7] Bureau of Labor Statistics: Plumbers, Pipefitters, and Steamfitters
- [8] BrightLocal: Local SEO Statistics
- [9] BrightLocal: Local Consumer Review Survey
- [10] Google Business Profile: Local business profile guidance
Frequently Asked Questions
Need more emergency plumbing calls from the right neighborhoods?
We will review your emergency pages, Google Business Profile, call tracking, reviews, and service-area coverage so you can see what is leaking calls.
Run My Free SEO Leak Check